Fig. 8.
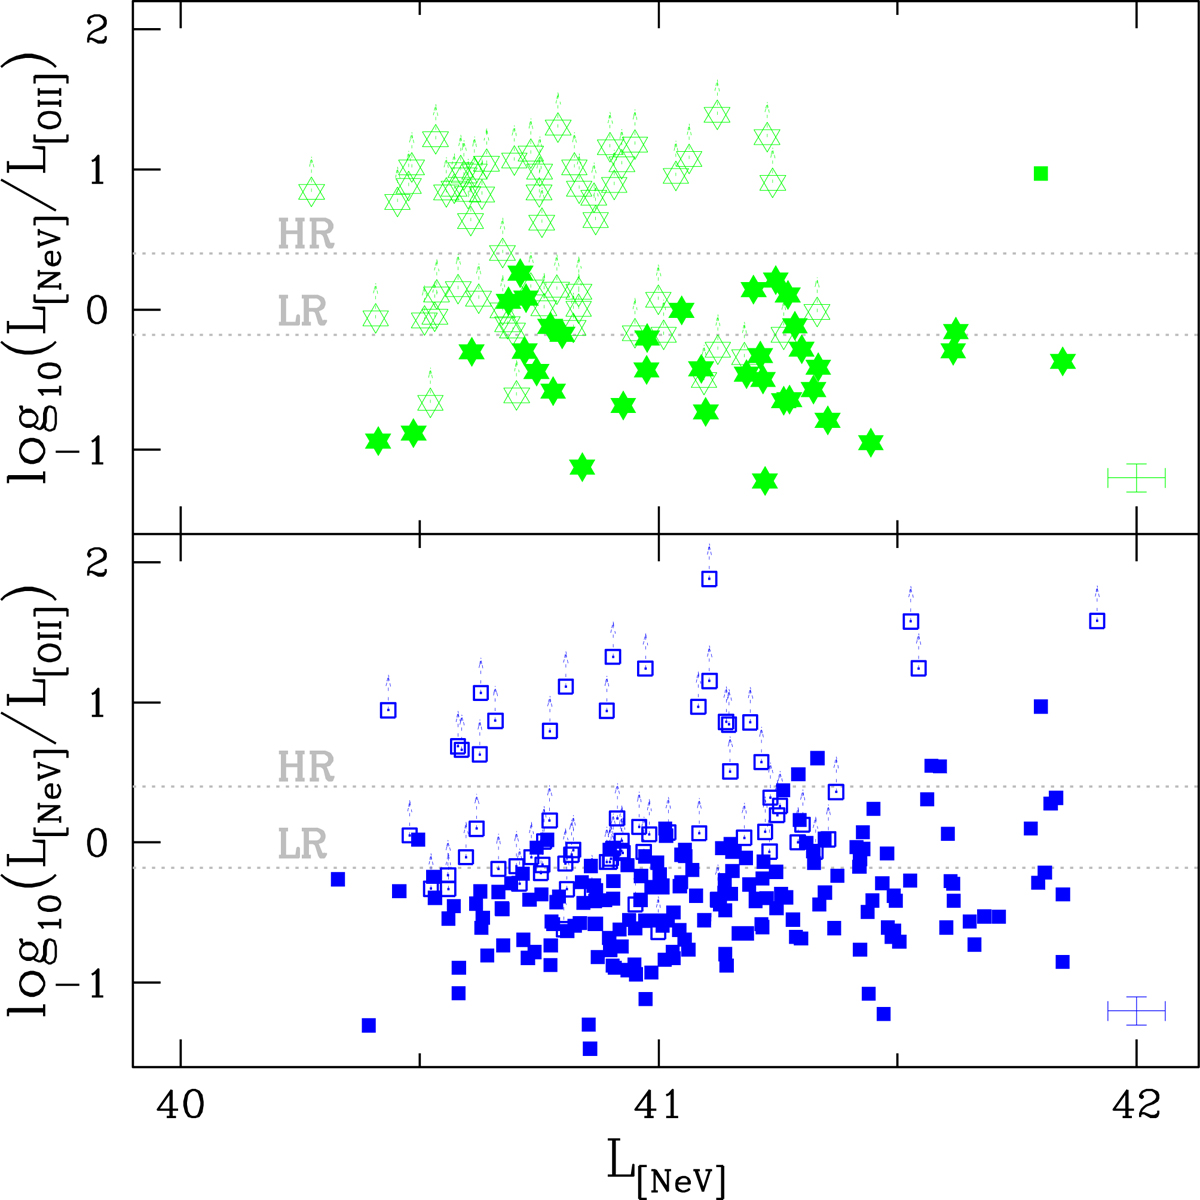
[NeV]-over-[OII] emission line ratios as a function of [NeV] luminosity for [NeV] emitters in the green valley (top) and blue cloud (bottom). Solid symbols are [OII] detected sources. Open symbols and arrows represent 3σ upper limits for [OII] non-detections. The typical error bars associated with these quantities are plotted in the bottom right corner of the two panels. The horizontal lines show the separation of each class into three equally populated regions. The combined spectra of galaxies with extreme ratios (HR and LR) are plotted in Fig. 9.
Current usage metrics show cumulative count of Article Views (full-text article views including HTML views, PDF and ePub downloads, according to the available data) and Abstracts Views on Vision4Press platform.
Data correspond to usage on the plateform after 2015. The current usage metrics is available 48-96 hours after online publication and is updated daily on week days.
Initial download of the metrics may take a while.