Fig. 6.
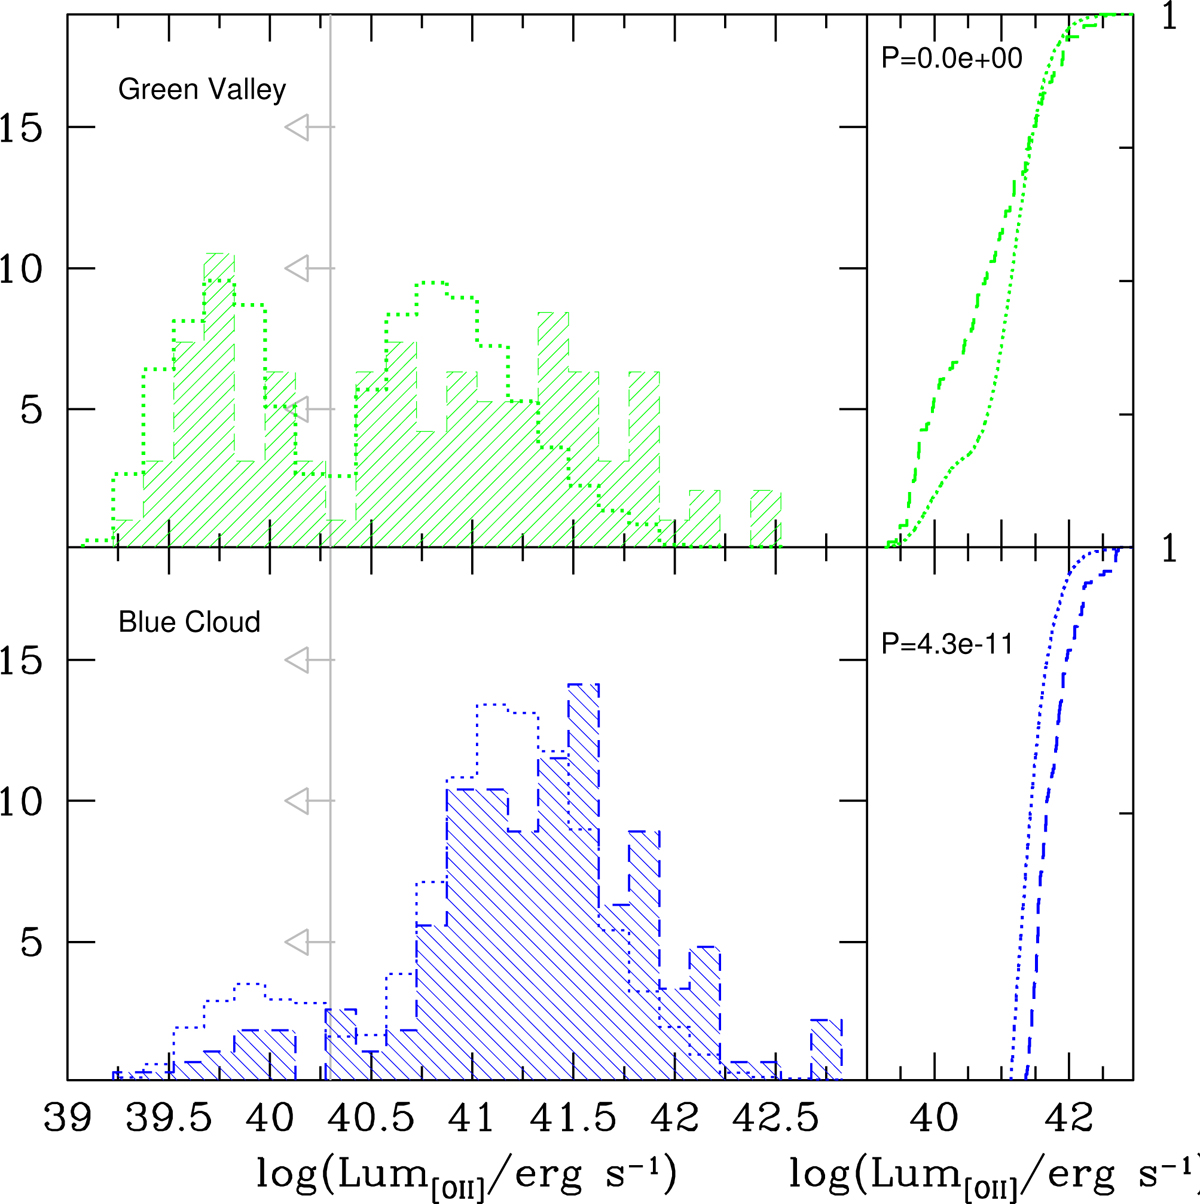
Distribution of the [NeV] (top) and [OII] (bottom) luminosities (in erg s−1) of the [NeV] emitters and their parent populations plotted in logarithmic scale. Symbols and numbers are as in Figs. 4 and 5, respectively. The t-student test and Kolmogorov–Smirnov test consider as extremely statistically significant, the difference between the luminosity (in the [OII] line) distributions of [NeV] emitters (dashed curve) and their parent samples (dotted curve). The vertical lines and arrows represent the luminosities where the 3σ upper limits enter in the computation. The difference between [NeV] emitters and their parent galaxies remains statistically significant even if only the detections are considered.
Current usage metrics show cumulative count of Article Views (full-text article views including HTML views, PDF and ePub downloads, according to the available data) and Abstracts Views on Vision4Press platform.
Data correspond to usage on the plateform after 2015. The current usage metrics is available 48-96 hours after online publication and is updated daily on week days.
Initial download of the metrics may take a while.