Fig. 7.
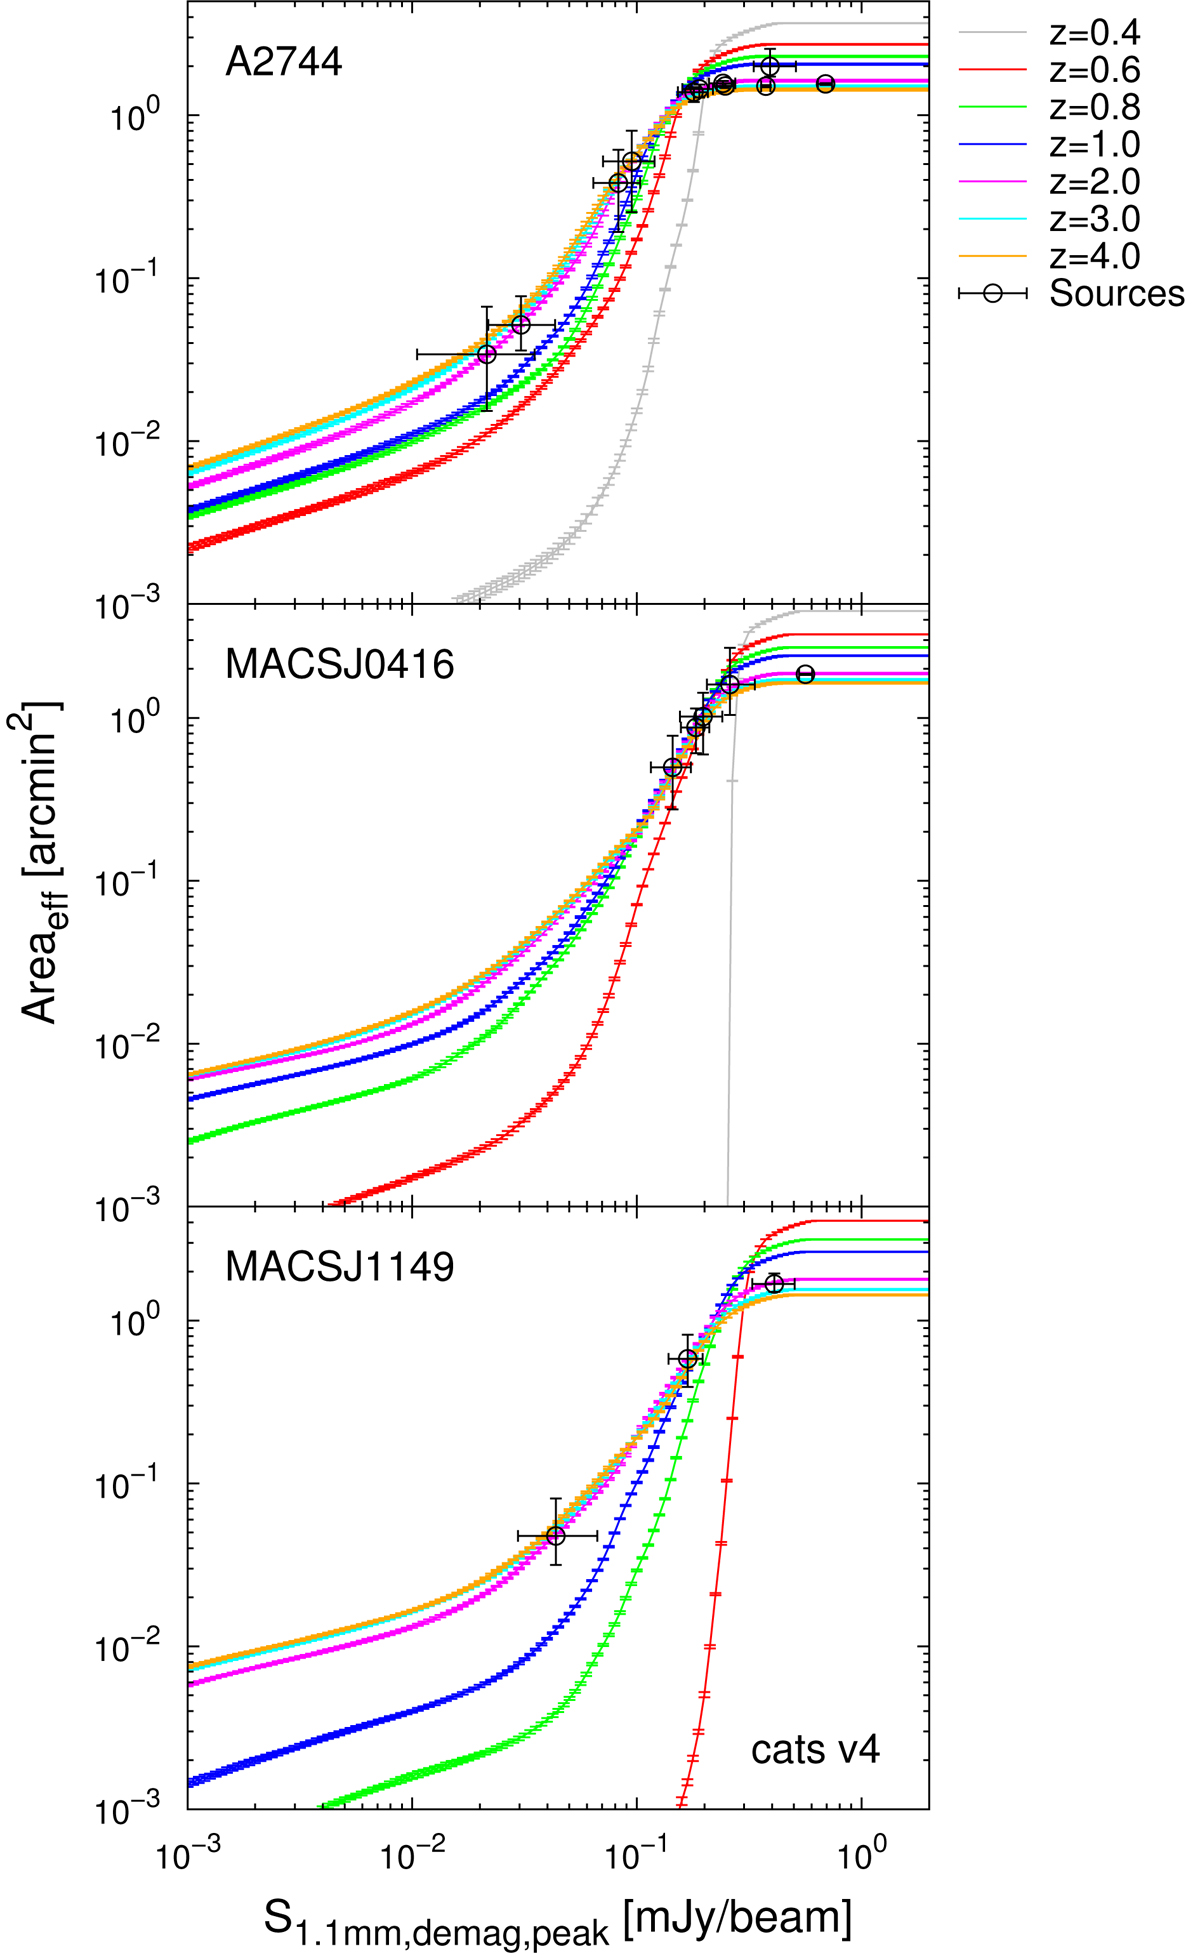
Median effective area as a function of demagnified peak intensity at several redshifts as indicated in the key (colored lines) for the CATS v4 lens model. Values for our S/N ≥ 4.5 sources (black symbols) are shown for this model (corresponding to the red crosses in Fig. 8). Error bars indicate the 16th and 84th percentiles. For each curve, these are obtained using the “range” maps at the corresponding redshift, while for symbols they are computed as described in Sect. 3.5. At z ≥ 2, areas do not differ significantly with redshift for this lens model.
Current usage metrics show cumulative count of Article Views (full-text article views including HTML views, PDF and ePub downloads, according to the available data) and Abstracts Views on Vision4Press platform.
Data correspond to usage on the plateform after 2015. The current usage metrics is available 48-96 hours after online publication and is updated daily on week days.
Initial download of the metrics may take a while.