Fig. 11.
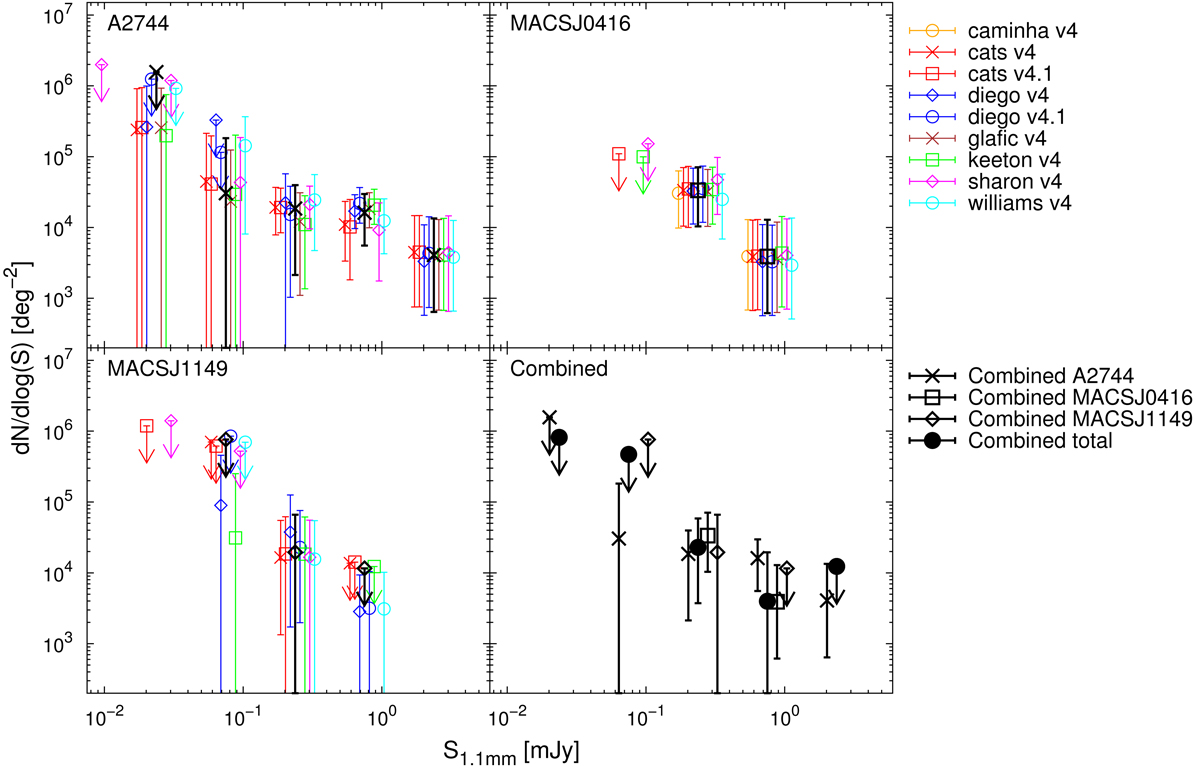
Demagnified differential counts at 1.1 mm, for each cluster (see legends at top-left) and combining all cluster fields (bottom-right panel). Values correspond to median counts for the lens models listed in Table 2 (colored symbols), combining all models for each cluster field (large black crosses, squares and diamonds) and combining all models for all cluster fields (large black filled circles). Error bars indicate the 16th and 84th percentiles, adding the scaled Poisson confidence levels for 1σ lower and upper limits respectively in quadrature. Arrows indicate 3σ upper limits for flux density bins having zero median counts and non-zero values at the 84th percentile. In the first three panels, counts for each model have been offset in flux around the combined counts for clarity. In the bottom-right panel, this is done for each galaxy cluster field around the counts that combine all models for all cluster fields.
Current usage metrics show cumulative count of Article Views (full-text article views including HTML views, PDF and ePub downloads, according to the available data) and Abstracts Views on Vision4Press platform.
Data correspond to usage on the plateform after 2015. The current usage metrics is available 48-96 hours after online publication and is updated daily on week days.
Initial download of the metrics may take a while.