Fig. 4.
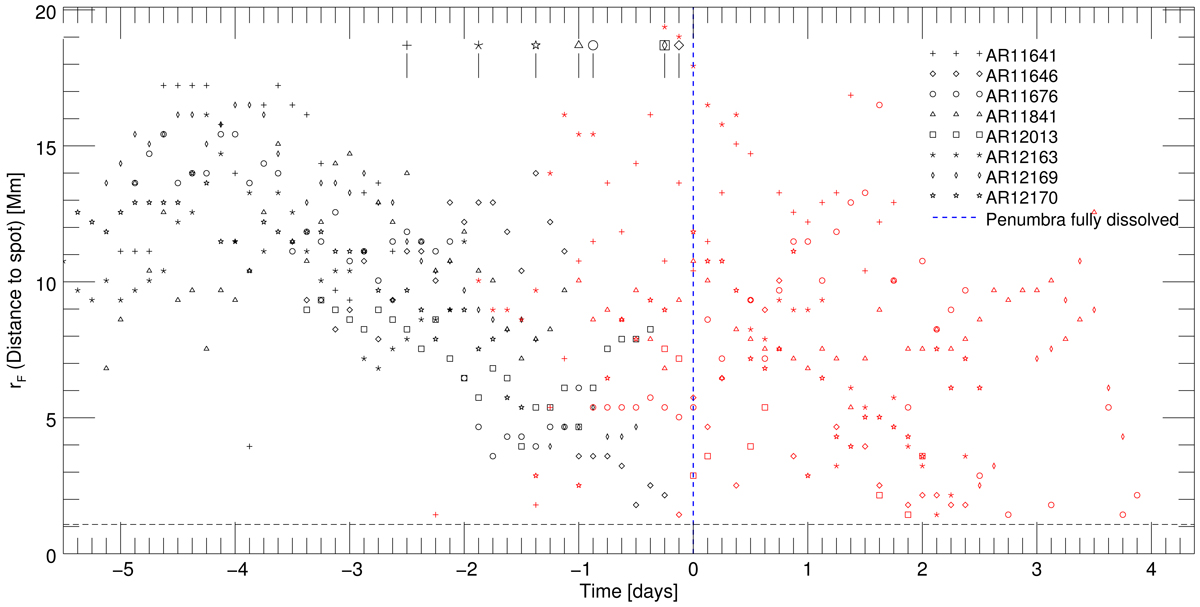
Extension of the flow field around all analysed active regions. Black symbols indicate the active regions to be localised on the eastern side on the meridian, while red symbols show values for the active region in the western hemisphere. The black vertical lines and symbols display the approximate crossing of the meridian by the respective sunspot in time. The loss of the penumbra is set as a common point in time.
Current usage metrics show cumulative count of Article Views (full-text article views including HTML views, PDF and ePub downloads, according to the available data) and Abstracts Views on Vision4Press platform.
Data correspond to usage on the plateform after 2015. The current usage metrics is available 48-96 hours after online publication and is updated daily on week days.
Initial download of the metrics may take a while.