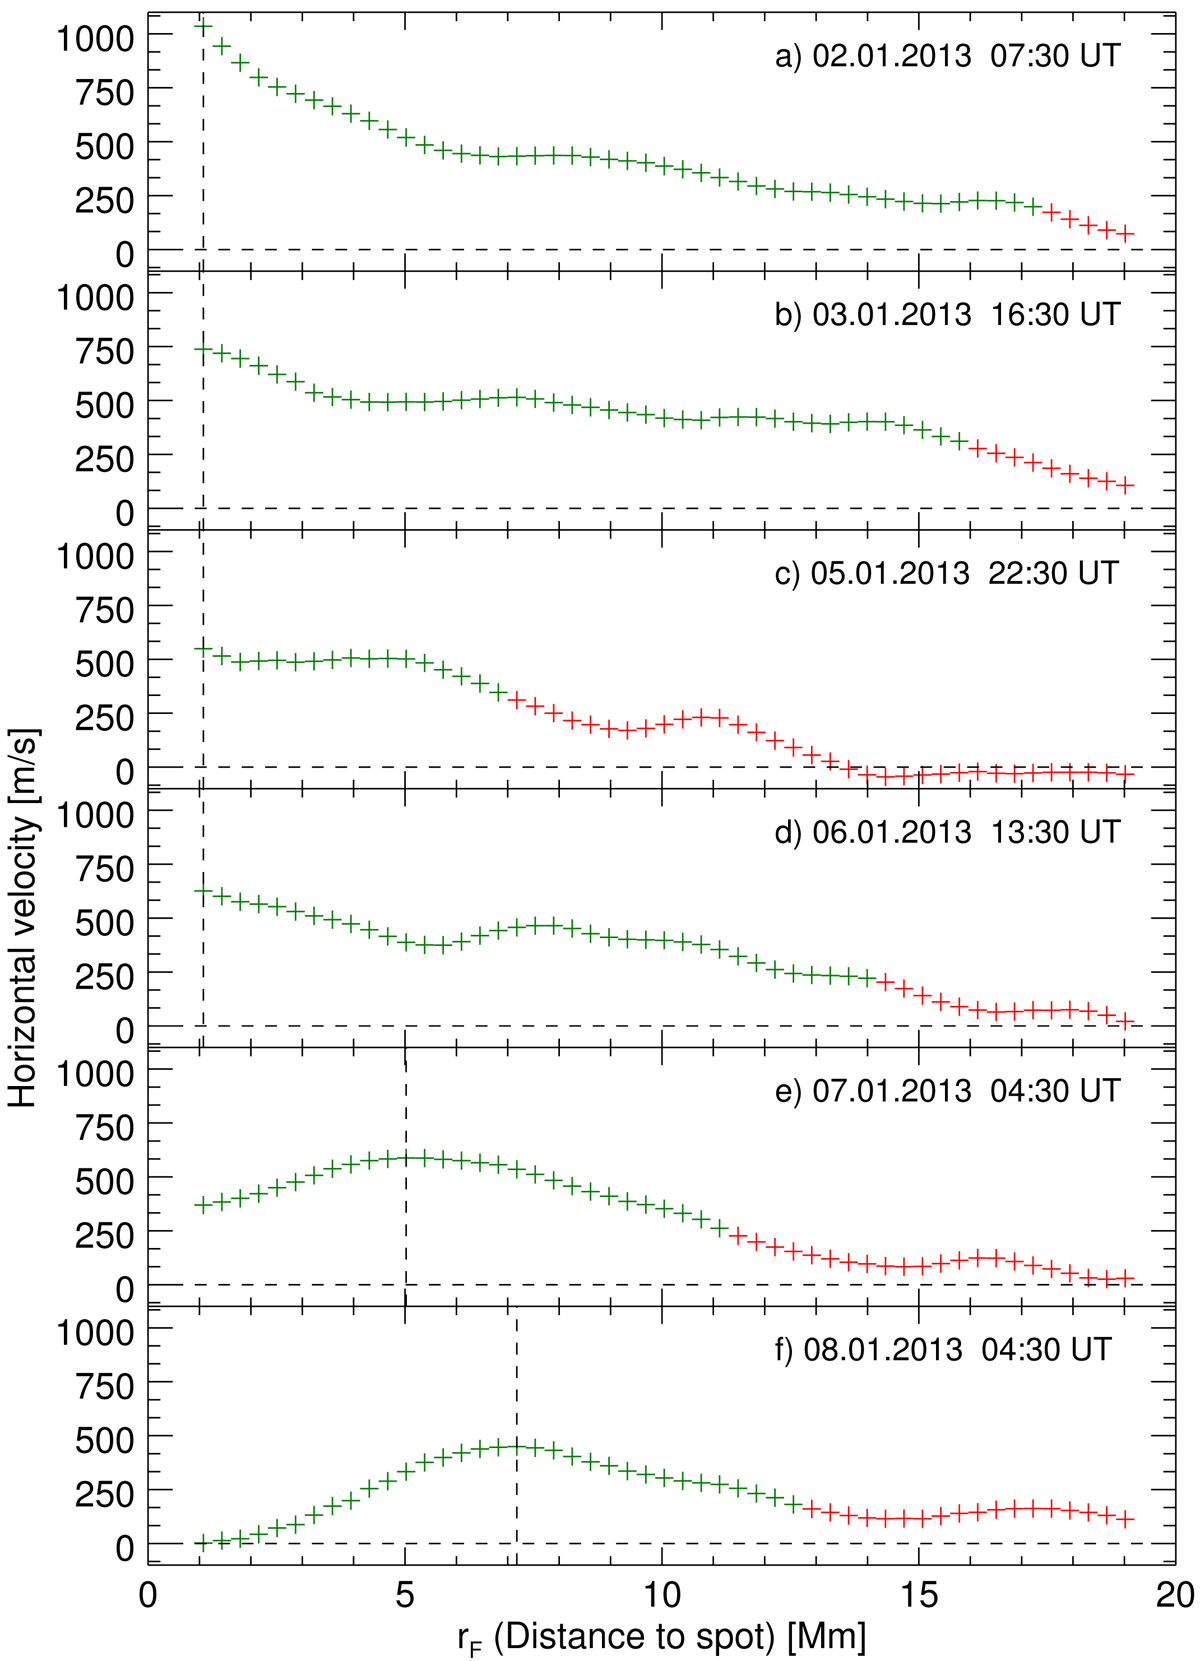
Fig. 3.

Velocity profiles of AR11641 for different times in the spot evolution. Transition from green to red in the profiles outlines the outer edge of flow field. A change in the shape of the velocity profile becomes apparent as the sunspot decays and the penumbra dissolves on 7 January 2013 at 01:30 UT. The vertical lines mark the distance to the spot for which the horizontal velocity is maximum.
Current usage metrics show cumulative count of Article Views (full-text article views including HTML views, PDF and ePub downloads, according to the available data) and Abstracts Views on Vision4Press platform.
Data correspond to usage on the plateform after 2015. The current usage metrics is available 48-96 hours after online publication and is updated daily on week days.
Initial download of the metrics may take a while.


