Fig. 2.
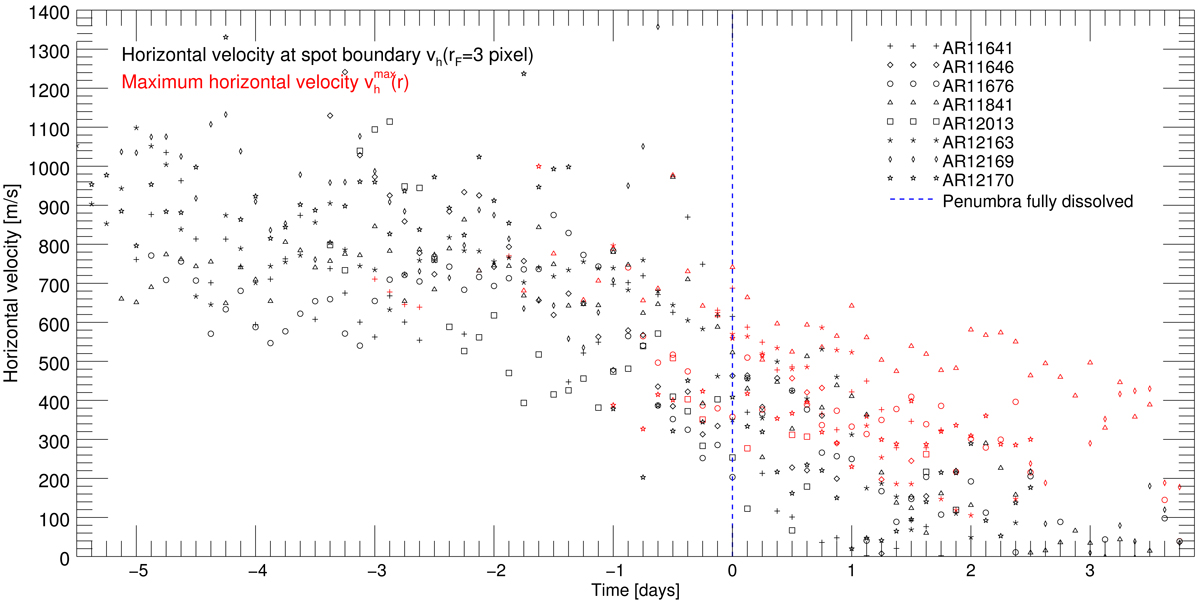
Evolution of the maximum velocity ![]() (black) and velocity at the spot boundary vh(1.1 Mm) (red) of the flow field for all analysed active regions. If the maximum velocity is localised at the sunspot boundary, these values are equal to vh(1.1 Mm) and are not visible in the diagram. The abscissa values are given in days with the loss of the penumbra being set as a common point in time.
(black) and velocity at the spot boundary vh(1.1 Mm) (red) of the flow field for all analysed active regions. If the maximum velocity is localised at the sunspot boundary, these values are equal to vh(1.1 Mm) and are not visible in the diagram. The abscissa values are given in days with the loss of the penumbra being set as a common point in time.
Current usage metrics show cumulative count of Article Views (full-text article views including HTML views, PDF and ePub downloads, according to the available data) and Abstracts Views on Vision4Press platform.
Data correspond to usage on the plateform after 2015. The current usage metrics is available 48-96 hours after online publication and is updated daily on week days.
Initial download of the metrics may take a while.