Fig. 9.
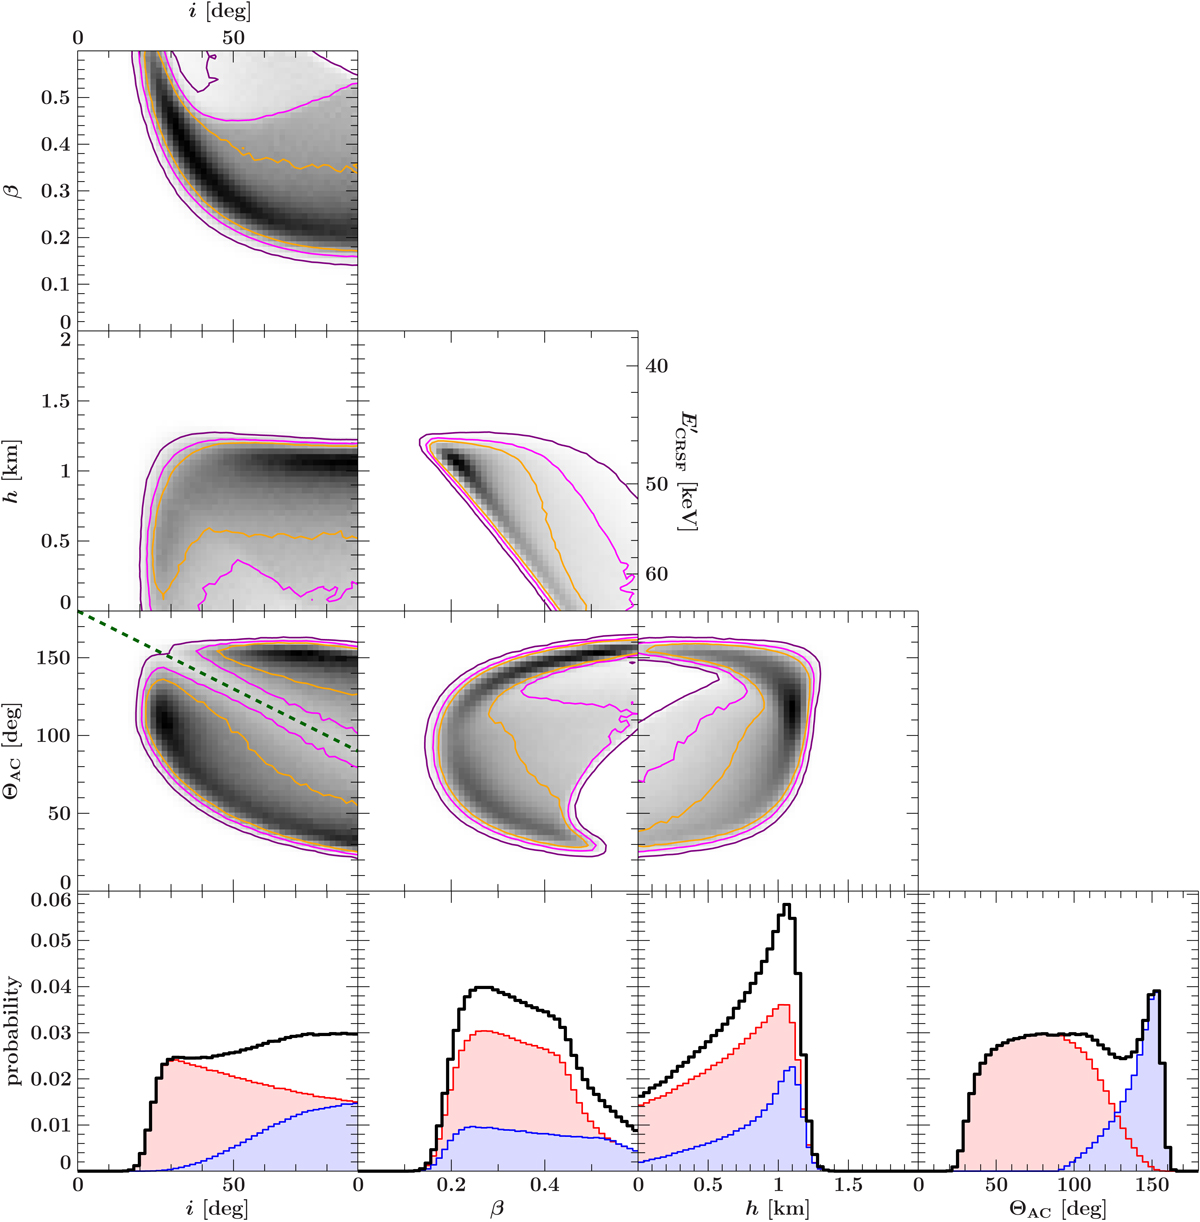
Parameter probabilities for the model described in Sect. 5.2 obtained from Monte Carlo simulations (EMCEE). Parameter correlations are shown as color maps, where black corresponds to the highest probability. Purple, magenta, and orange correspond to the 99%, 90% and 68% probability levels. In the i − ΘAC space there are two solutions visible, which are divided by ΘAC = −i + 180° (green dashed line), where i is the inclination and ΘAC is the polar angle of the accretion column. The bottom panels show the one dimensional parameter probabilities, where red and blue histograms correspond to the individual solutions.
Current usage metrics show cumulative count of Article Views (full-text article views including HTML views, PDF and ePub downloads, according to the available data) and Abstracts Views on Vision4Press platform.
Data correspond to usage on the plateform after 2015. The current usage metrics is available 48-96 hours after online publication and is updated daily on week days.
Initial download of the metrics may take a while.