Fig. 5.
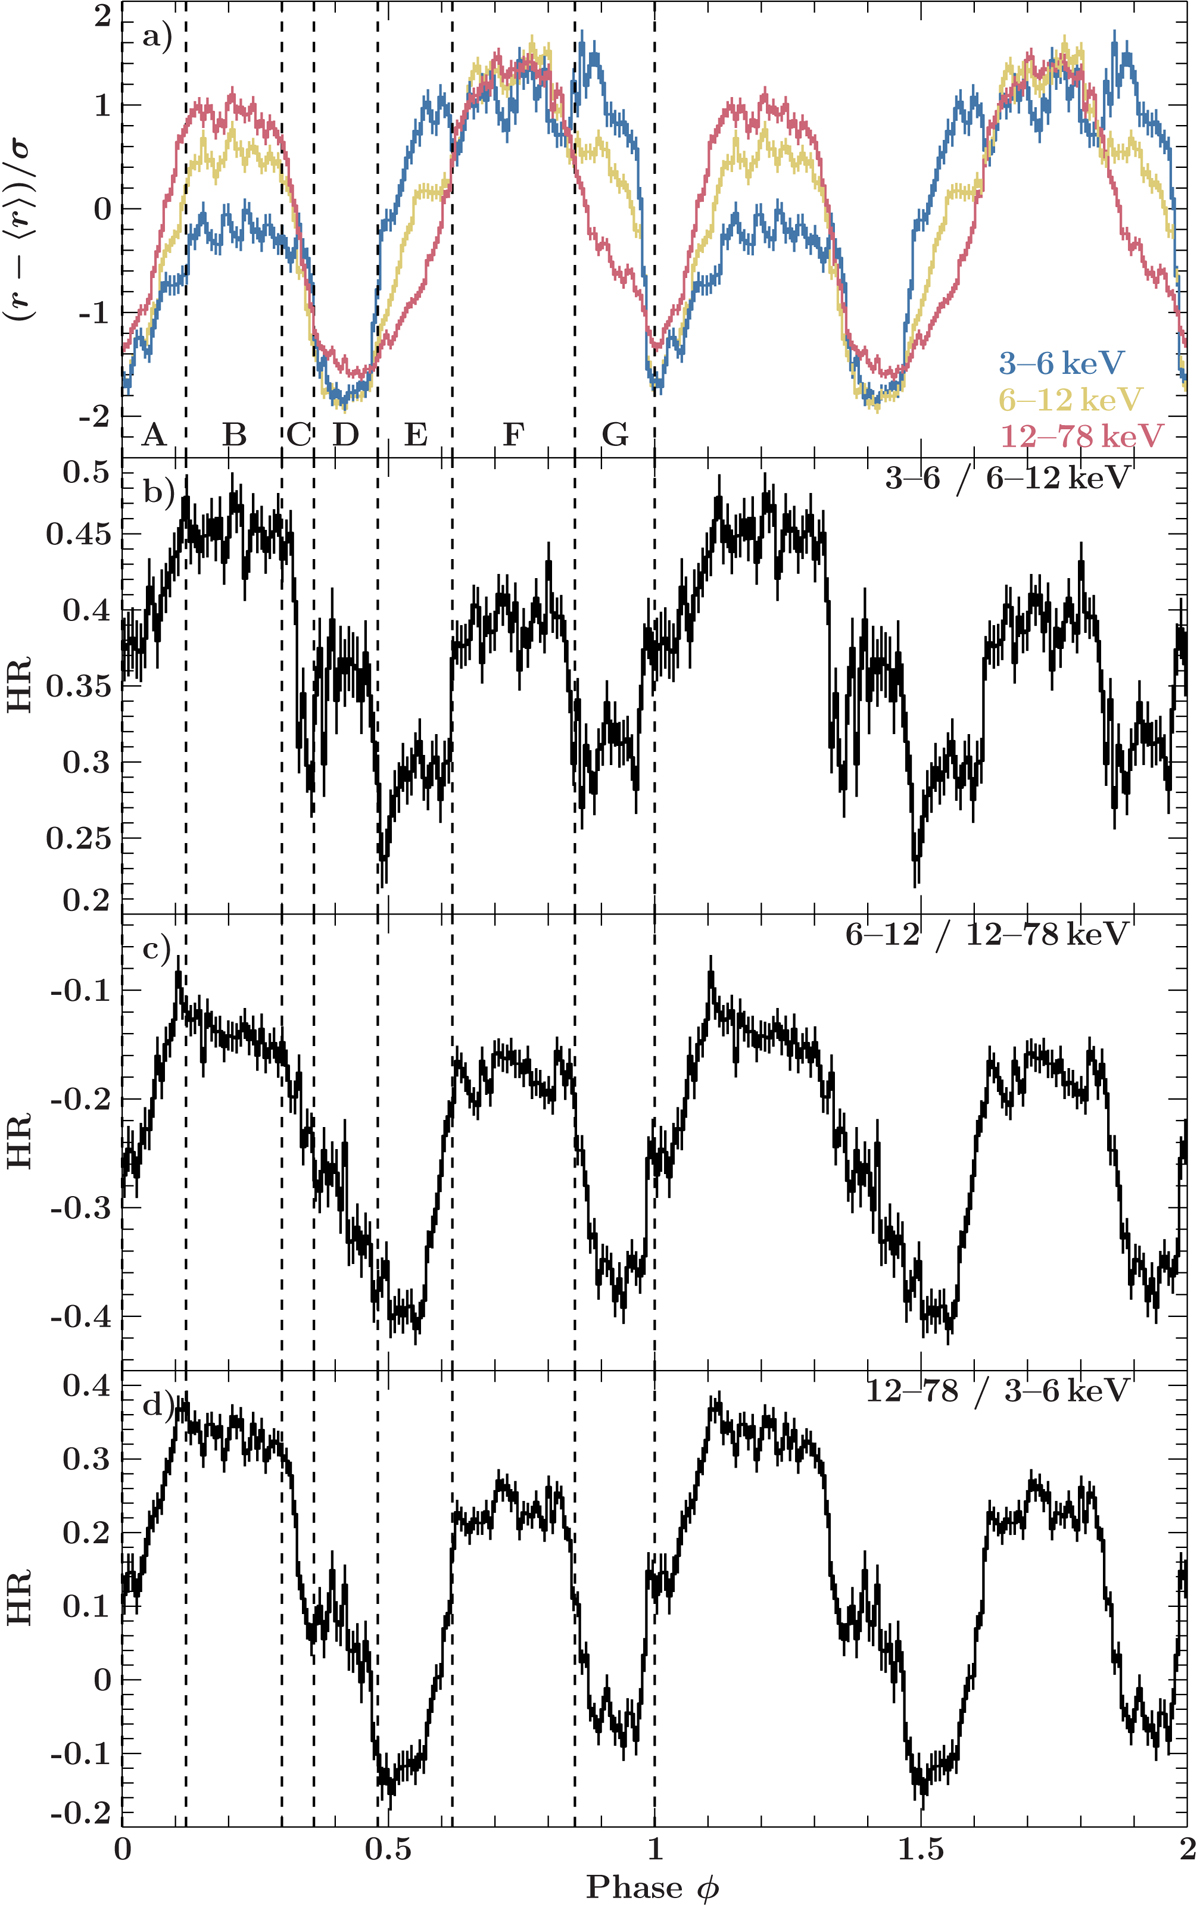
Panel a: pulse profiles of observation 2 in three different energy bands: 3–6 keV (blue), 6–12 keV (yellow), and 12–78 keV (red). The profiles were normalized by subtracting the respective mean rate and dividing by the respective standard deviation to allow for easier comparison of the shape between energy bands. The lower panels show the hardness ratio between each pair of these pulse profiles. The hardness ratio is calculated as (H − S)/(H + S), where H is the profile in the harder band, and S the profile in the softer band. Panel b: hardness ratio between the 3–6 keV and 6–12 keV profiles. Panel c: hardness ratio between the 6–12 keV and 12–78 keV profiles. Panel d: hardness ratio between the 3–6 keV and 12–78 keV profiles. The dashed lines indicate the phases selected for phase-resolved spectroscopy.
Current usage metrics show cumulative count of Article Views (full-text article views including HTML views, PDF and ePub downloads, according to the available data) and Abstracts Views on Vision4Press platform.
Data correspond to usage on the plateform after 2015. The current usage metrics is available 48-96 hours after online publication and is updated daily on week days.
Initial download of the metrics may take a while.