Fig. 2.
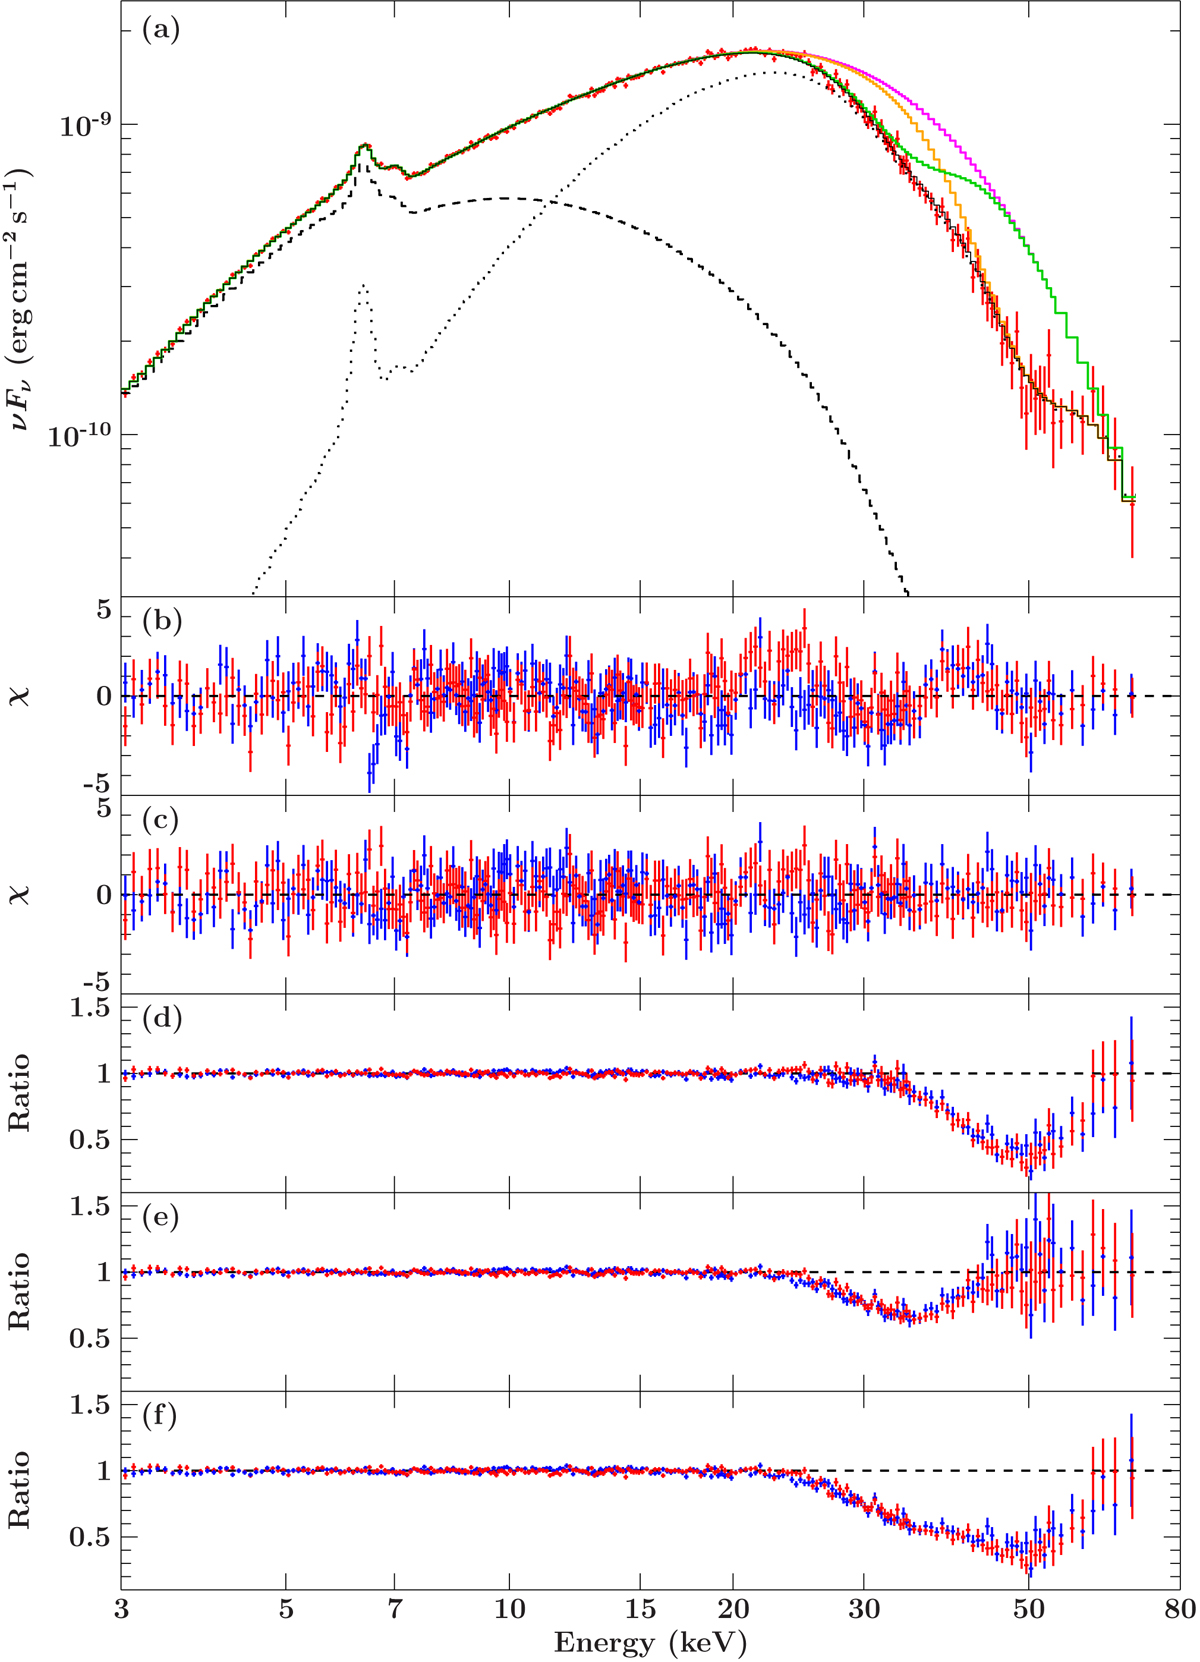
Spectrum of NuSTAR observation 2. Panel a: data from NuSTAR/FPMA (FPMB not shown for clarity), together with the best-fit NPEX model (black). We also show the two components of the NPEX model separately, indicating the soft component with a dashed line and the harder component (for which the photon-index is fixed to −2) with a dotted line. Additionally, we show the model with each CRSF removed in turn (orange and green) and with both removed (magenta). Panel b: residuals in terms of χ for the best-fit model with only 1 CRSF. Panel c: residuals to the best-fit model with 2 CRSFs Panel d: residuals in terms of data-to-model ratio without the 50 keV CRSF. Panel e: residuals without the 35 keV CRSF. Panel f: residuals without both CRSFs. In this panel the non-symmetric shape of the residuals can be clearly seen.
Current usage metrics show cumulative count of Article Views (full-text article views including HTML views, PDF and ePub downloads, according to the available data) and Abstracts Views on Vision4Press platform.
Data correspond to usage on the plateform after 2015. The current usage metrics is available 48-96 hours after online publication and is updated daily on week days.
Initial download of the metrics may take a while.