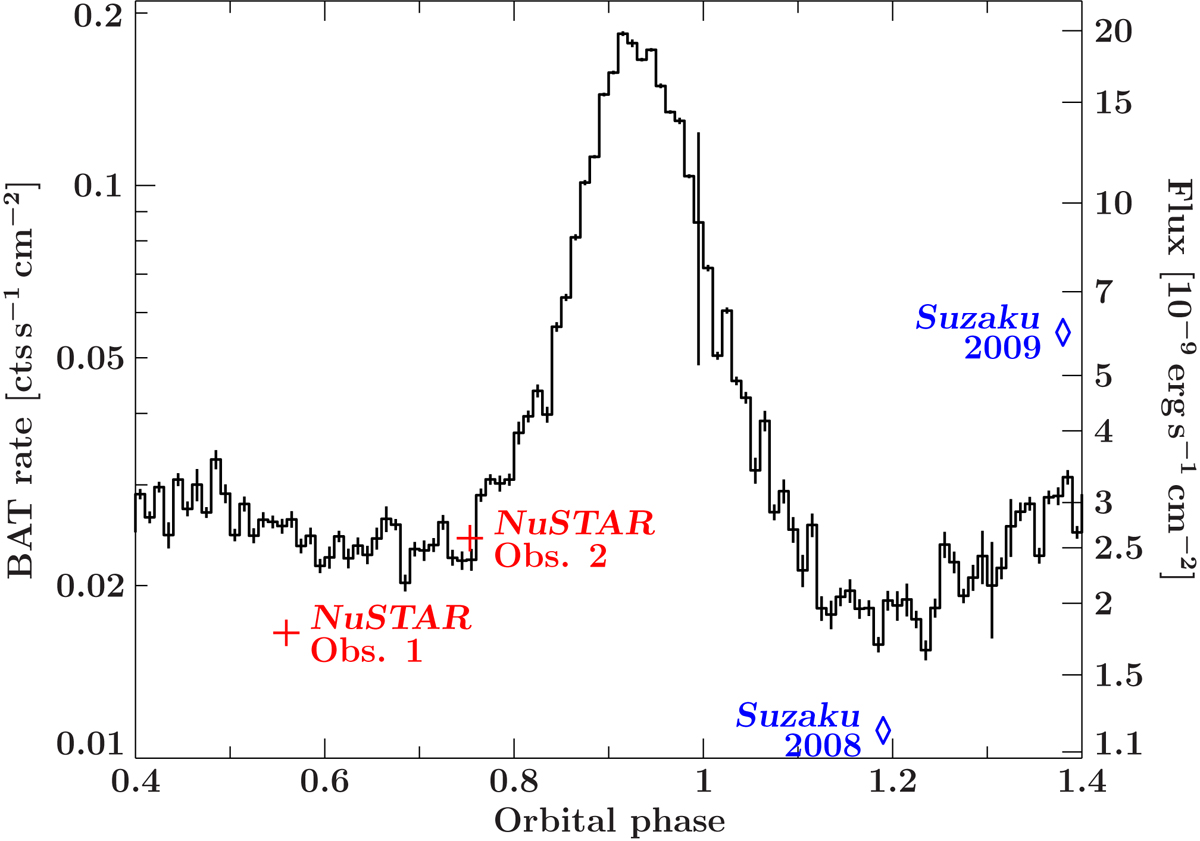
Fig. 1.

Average light curve from the Burst Alert Telescope (BAT) of Swift, folded on the orbital period where orbital phase 1 is periastron. A strong flare shortly before periastron is clearly visible. We note that due to the eccentric orbit, the phases are not equidistant in time. The two NuSTAR observations are shown by the red crosses and the Suzaku observations by the blue diamonds. These data use the right-hand y-scale with the flux measured between 5 and 50 keV. The left and right y-scales are aligned based on the daily BAT count rate measured during the NuSTAR observations. We note the strong variability above and below the average flux in the pointed observations of NuSTAR and Suzaku.
Current usage metrics show cumulative count of Article Views (full-text article views including HTML views, PDF and ePub downloads, according to the available data) and Abstracts Views on Vision4Press platform.
Data correspond to usage on the plateform after 2015. The current usage metrics is available 48-96 hours after online publication and is updated daily on week days.
Initial download of the metrics may take a while.


