Fig. 4.
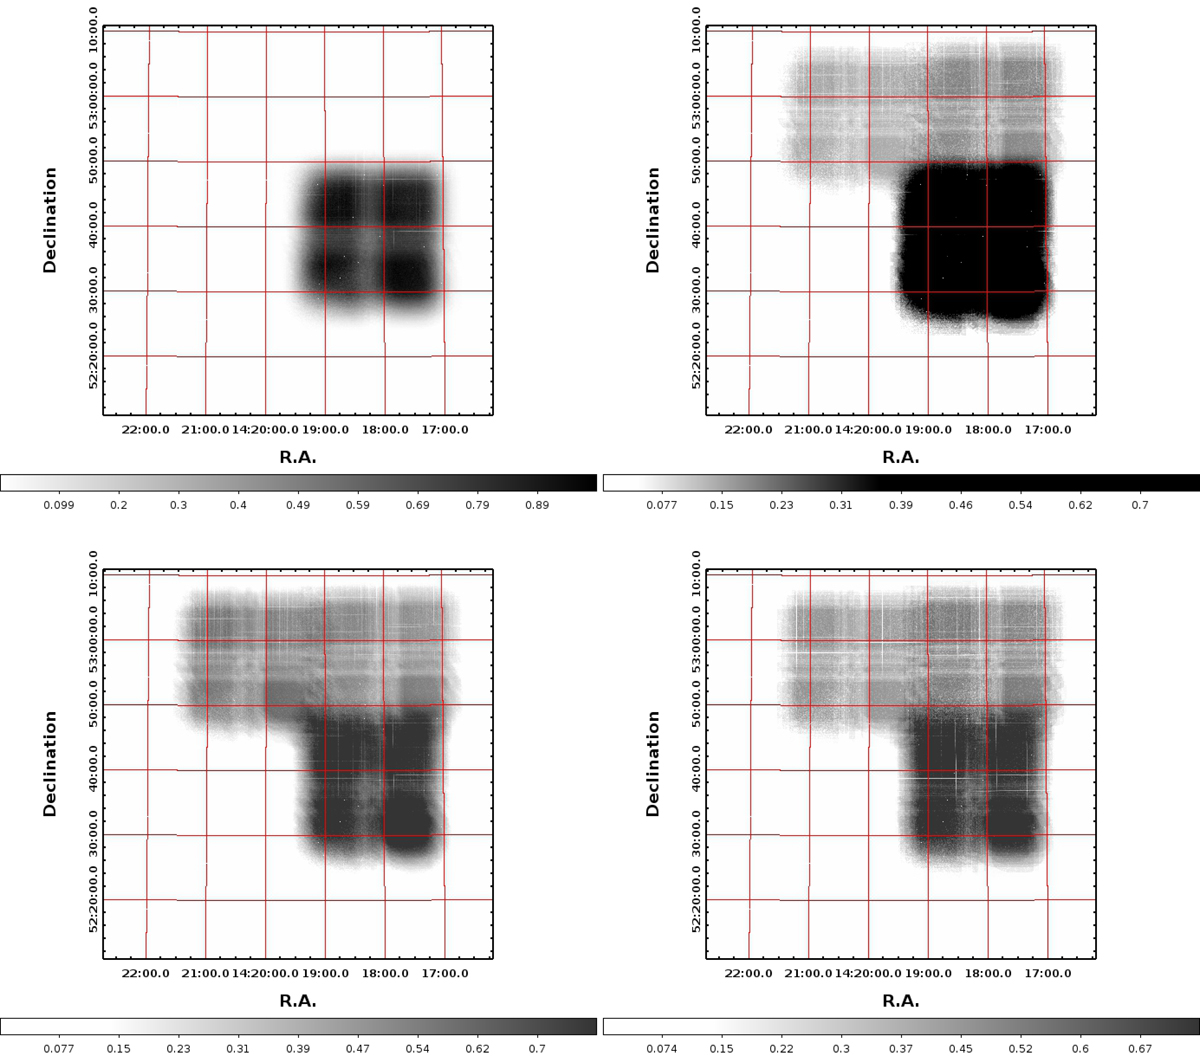
Exposure-time maps for the CFHTLS-D3 field of view in Y (top left panel), J (top right panel), H (bottom left panel) and Ks bands (bottom right panel). Gray levels display in linear scale the regions where near-IR data are available. Note the different exposure times between the WUDS (deep) region and the wide field extended region of WIRDS.
Current usage metrics show cumulative count of Article Views (full-text article views including HTML views, PDF and ePub downloads, according to the available data) and Abstracts Views on Vision4Press platform.
Data correspond to usage on the plateform after 2015. The current usage metrics is available 48-96 hours after online publication and is updated daily on week days.
Initial download of the metrics may take a while.