Fig. 11.
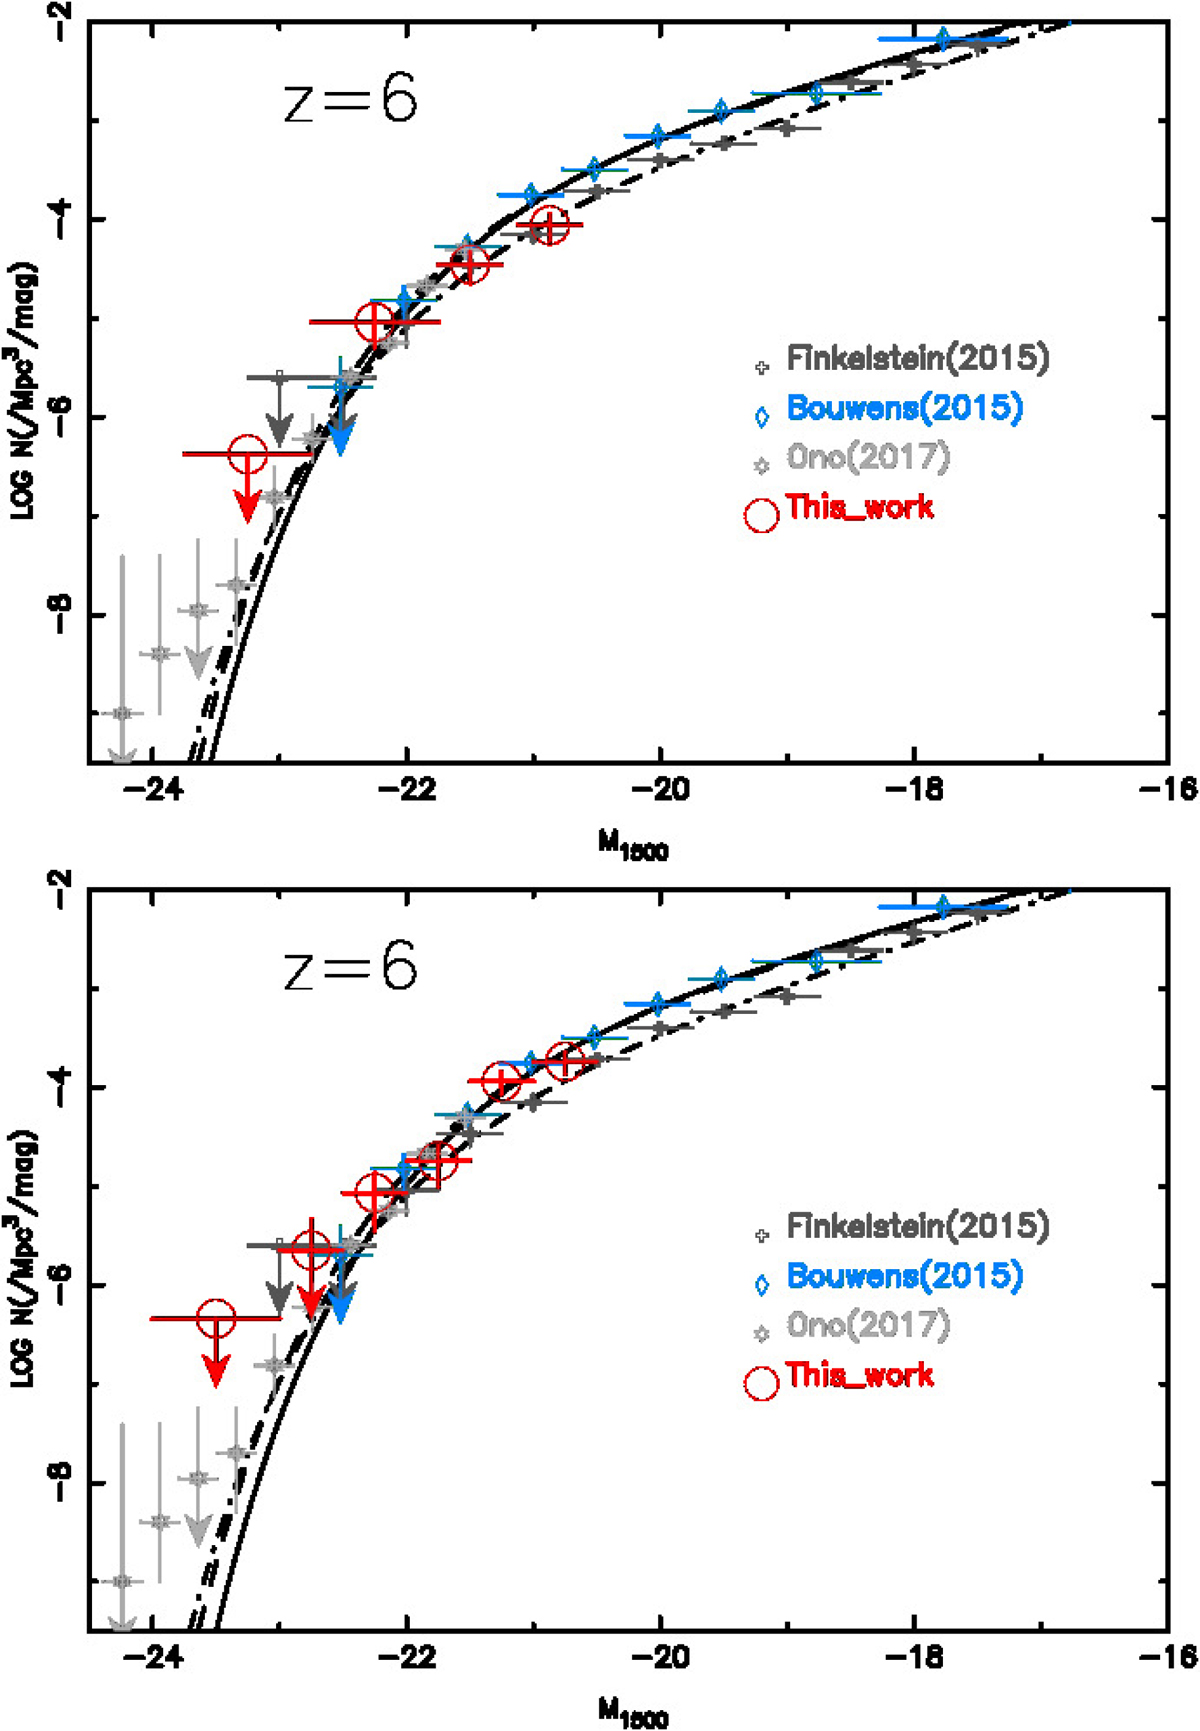
Comparison of the WUDS luminosity function at z = 6 with the equivalent estimates by Finkelstein et al. (2015; black crosses, dot-dashed line), Bouwens et al. (2015; blue diamonds, dashed line), and Ono et al. (2018; gray stars, dotted line) for the LBG color-selected sample (top panel) and photometric redshifts applied to the i-drop sample (bottom panel). The best Schechter fits to WUDS + extended data are plotted by solid lines. For the LBG color-selected sample presented in this figure, the slope has been fixed as in Bouwens et al. (2015; see Sect. 7.3).
Current usage metrics show cumulative count of Article Views (full-text article views including HTML views, PDF and ePub downloads, according to the available data) and Abstracts Views on Vision4Press platform.
Data correspond to usage on the plateform after 2015. The current usage metrics is available 48-96 hours after online publication and is updated daily on week days.
Initial download of the metrics may take a while.