Fig. 10.
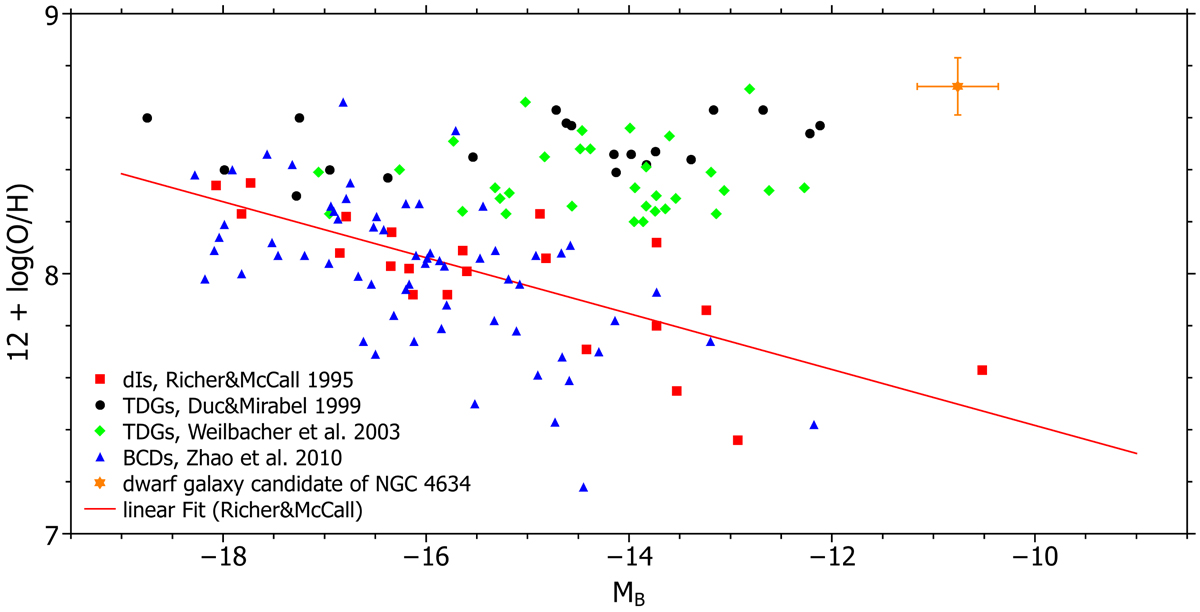
Luminosity–metallicity relation. The data point of the dwarf galaxy candidate is represented by the orange star. The data of Richer & McCall (1995) of dwarf irregular galaxies (dIs) are shown as red squares. The fit to that data by Richer & McCall (1995) is shown as the red line. The relation of the data of blue compact dwarfs (BCDs, blue triangles) is from Zhao et al. (2010). The data of TDGs from Duc & Mirabel (1999) are represented as dark circles, and the data from Weilbacher et al. (2003) as green diamonds.
Current usage metrics show cumulative count of Article Views (full-text article views including HTML views, PDF and ePub downloads, according to the available data) and Abstracts Views on Vision4Press platform.
Data correspond to usage on the plateform after 2015. The current usage metrics is available 48-96 hours after online publication and is updated daily on week days.
Initial download of the metrics may take a while.