Fig. 7
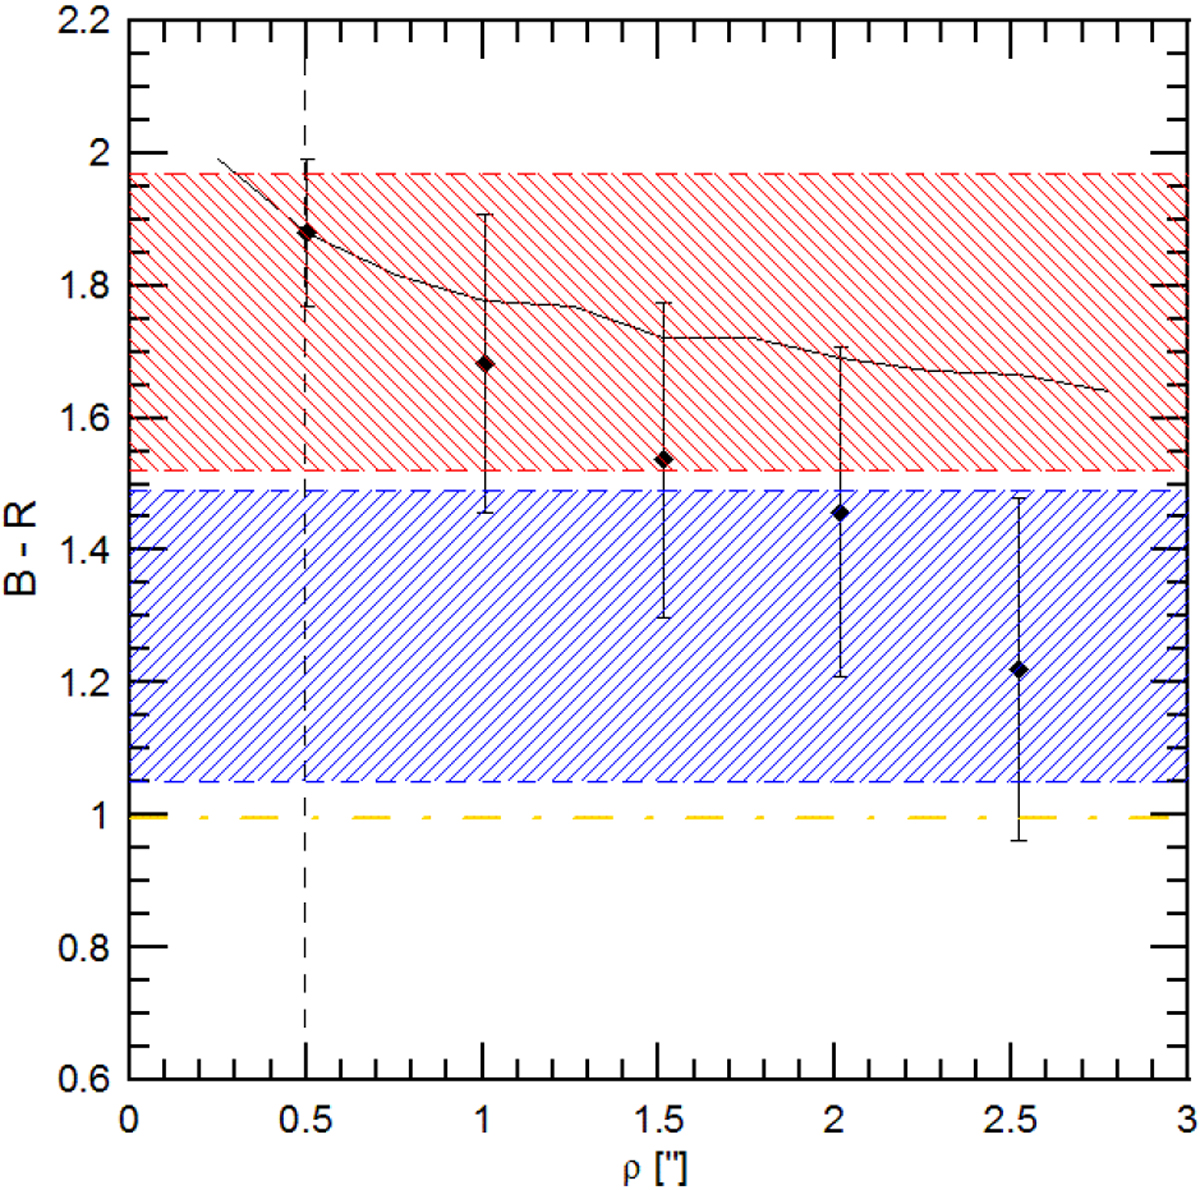
Comparison of integrated [B–R] colour of centaur 523676 (2013 UL10) (continuous black line) with respect to the colour derived in concentric annular regions with increasing distance from the optocentre (dots). Each dot represent the [B–R] colour derived in the annulus between that ρ value andthe preceding one. The blue and red dashed areas indicate lower and upper limits of the [B–R] colours of the blue and red inactive centaur groups, respectively, when adopting a gap at [B–R] = 1.50. The yellow dot-dashed line indicates the [B–R] colour of the Sun. The vertical dashed line indicates the considered limit for the nucleus (FWHM).
Current usage metrics show cumulative count of Article Views (full-text article views including HTML views, PDF and ePub downloads, according to the available data) and Abstracts Views on Vision4Press platform.
Data correspond to usage on the plateform after 2015. The current usage metrics is available 48-96 hours after online publication and is updated daily on week days.
Initial download of the metrics may take a while.