Fig. 3
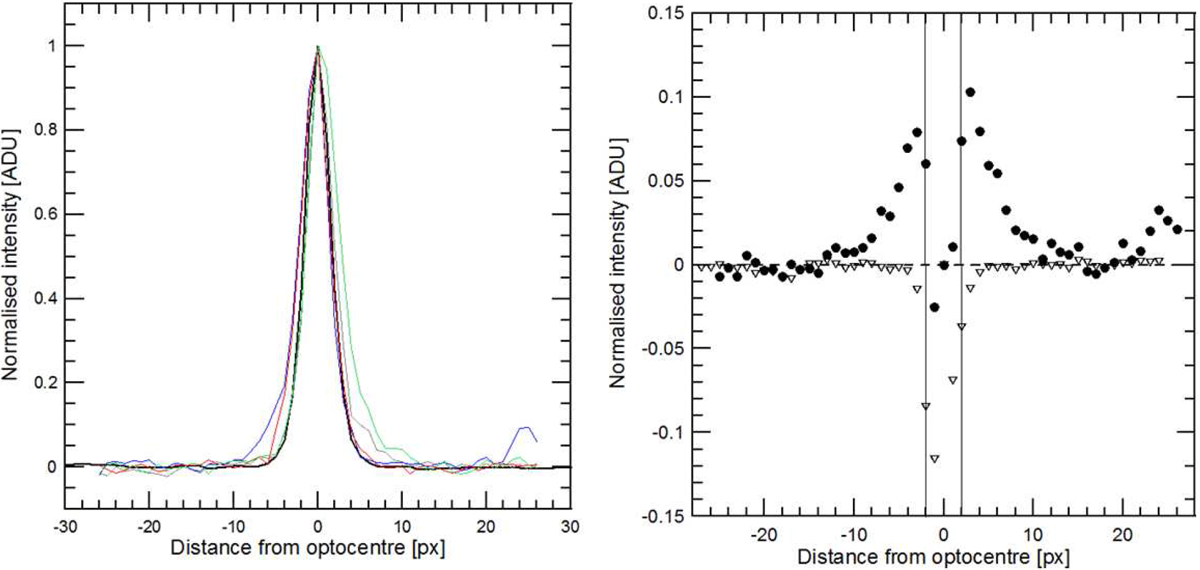
Example of profile analysis for one R image of 523676 (2013 UL10). Left panel: comparison of the four profiles in different directions (grey and blue lines: perpendicular and parallel to the apparent motion of the centaur, respectively; red and green lines: two orthogonal directions oriented at 45° with respectto the two above) around the centaur’s optocentre with the average stellar profile (thick black line). Right panel: comparison of residuals of centaur 523676 (2013 UL10) (filled dots) and 2008 FC76 (empty triangles) with respect to an in-field stellar profile.
Current usage metrics show cumulative count of Article Views (full-text article views including HTML views, PDF and ePub downloads, according to the available data) and Abstracts Views on Vision4Press platform.
Data correspond to usage on the plateform after 2015. The current usage metrics is available 48-96 hours after online publication and is updated daily on week days.
Initial download of the metrics may take a while.