Fig. 6
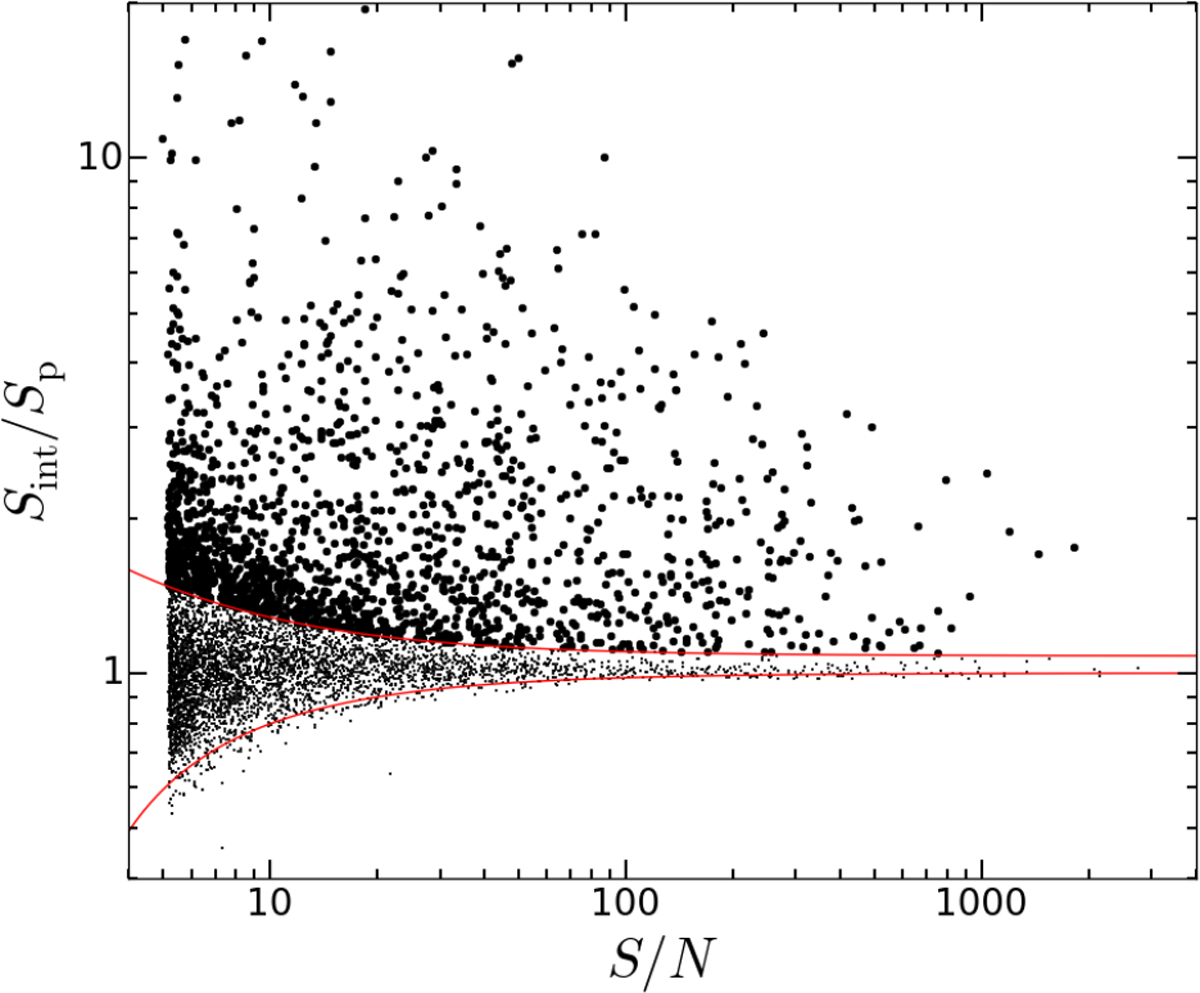
Sint∕Sp vs. S/N plot for all components with the peak flux densities corrected for bandwidth smearing (see Sect. 3.4). The lower and upper envelopes (red curves) are described by Eqs. (3) and (4), respectively. The components above the upper envelope are considered resolved, and the ones below it are considered unresolved.
Current usage metrics show cumulative count of Article Views (full-text article views including HTML views, PDF and ePub downloads, according to the available data) and Abstracts Views on Vision4Press platform.
Data correspond to usage on the plateform after 2015. The current usage metrics is available 48-96 hours after online publication and is updated daily on week days.
Initial download of the metrics may take a while.