Fig. 3
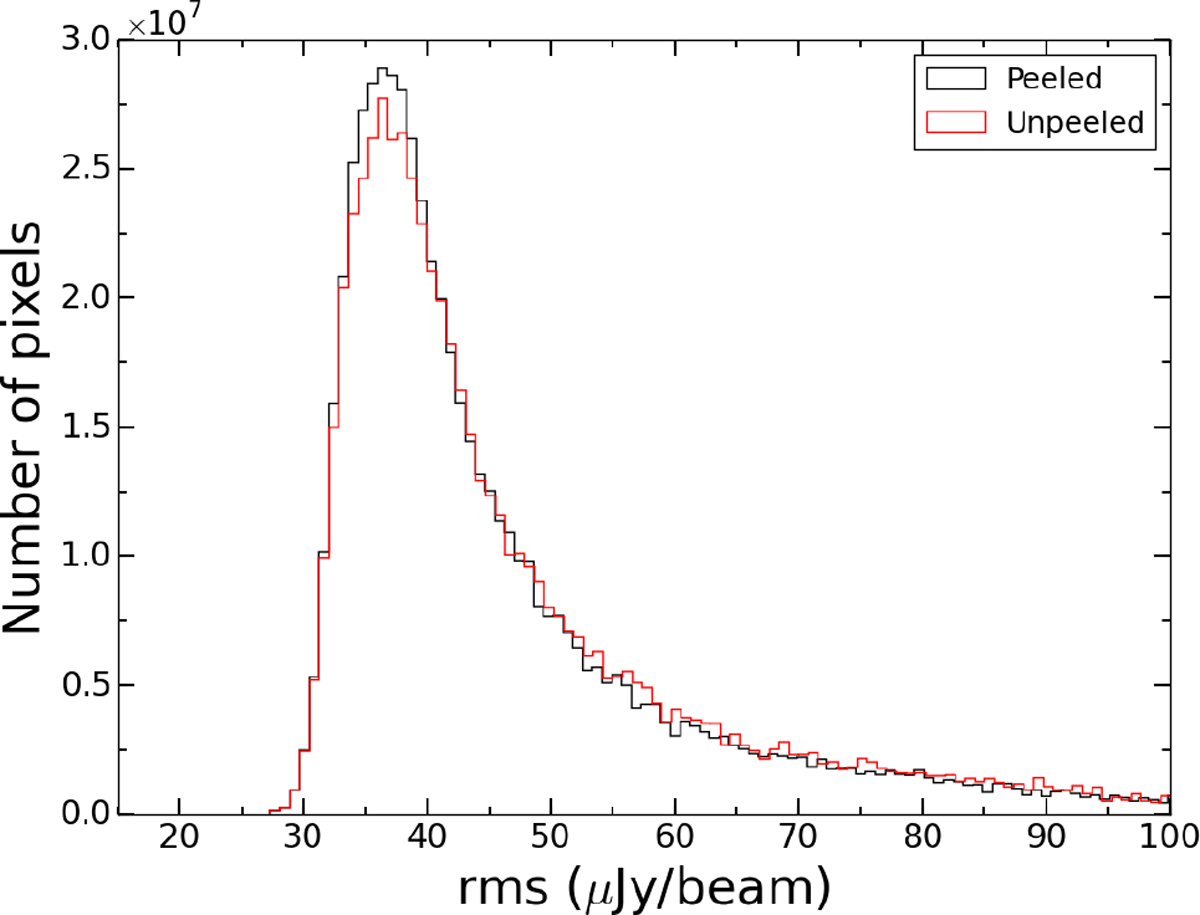
Noise distribution for the final 2.1 GHz mosaic of XXL-S (black histogram). The red histogram is the rms noise distribution for the same mosaic with the peeling step excluded. This demonstrates that the peeling reduced the number of high-noise pixels and increased the number of low-noise pixels.
Current usage metrics show cumulative count of Article Views (full-text article views including HTML views, PDF and ePub downloads, according to the available data) and Abstracts Views on Vision4Press platform.
Data correspond to usage on the plateform after 2015. The current usage metrics is available 48-96 hours after online publication and is updated daily on week days.
Initial download of the metrics may take a while.