Fig. 17
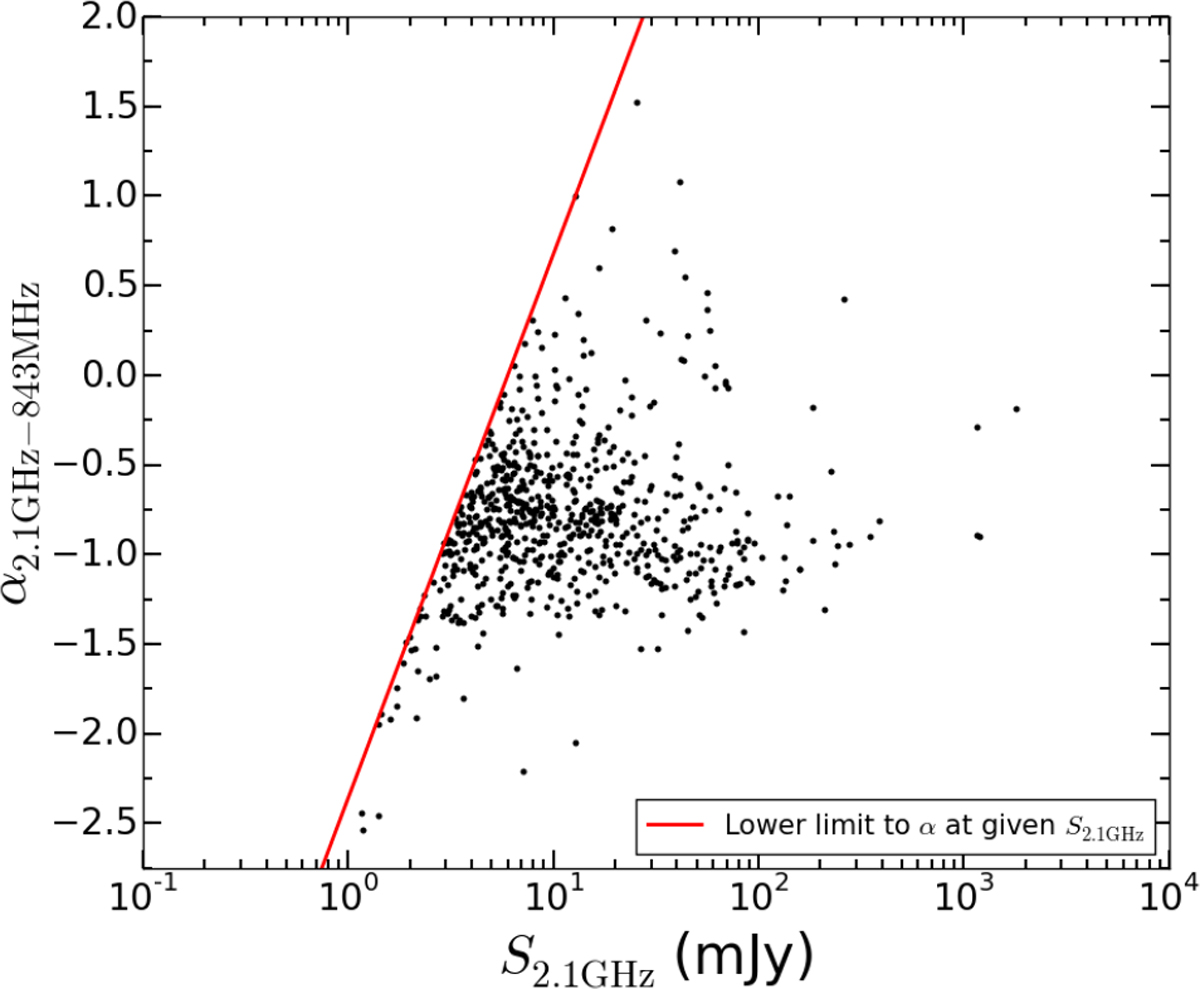
Spectral index vs. S2.1 GHz for SUMSS sources cross-matched to one or more ATCA XXL-S sources. The red line representsthe lower limit to the spectral indices for matched ATCA sources with a given S2.1 GHz. It clearly demonstrates that sources with flatter spectral indices are missed at the faintest flux density levels (S2.1GHz ≲ 3 mJy).
Current usage metrics show cumulative count of Article Views (full-text article views including HTML views, PDF and ePub downloads, according to the available data) and Abstracts Views on Vision4Press platform.
Data correspond to usage on the plateform after 2015. The current usage metrics is available 48-96 hours after online publication and is updated daily on week days.
Initial download of the metrics may take a while.