Fig. 15
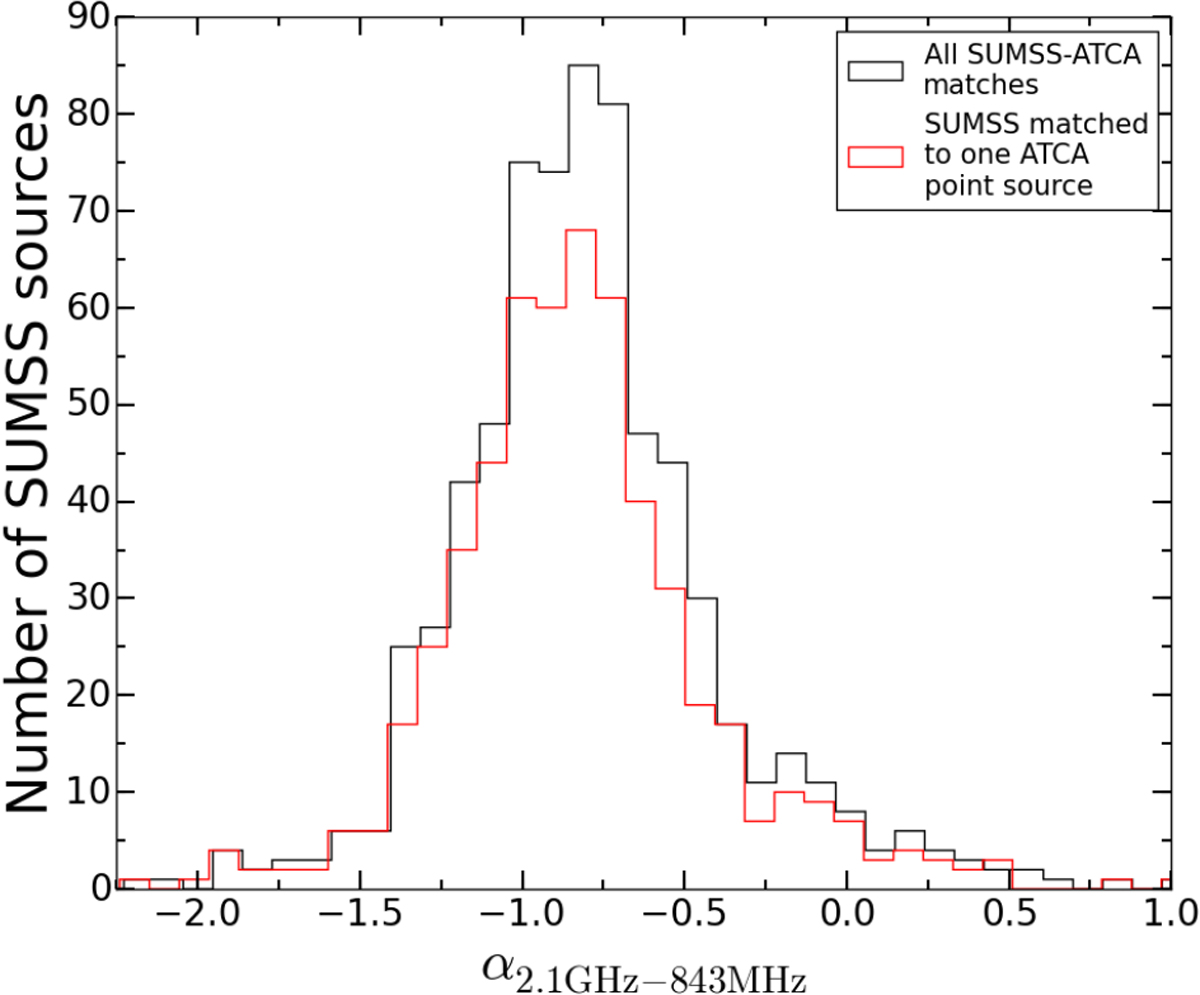
Spectral index distributions for the SUMSS 843 MHz sources cross-matched to one or more XXL-S 2.1 GHz sources. The black line represents the 699 SUMSS sources cross-matched to all ATCA XXL-S sources within 52.8″ and the red line represents the 560 SUMSS sources that were matched to exactly one ATCA XXL-S point source. The median spectral indices for these cases are − 0.83 and − 0.85, respectively.
Current usage metrics show cumulative count of Article Views (full-text article views including HTML views, PDF and ePub downloads, according to the available data) and Abstracts Views on Vision4Press platform.
Data correspond to usage on the plateform after 2015. The current usage metrics is available 48-96 hours after online publication and is updated daily on week days.
Initial download of the metrics may take a while.