Fig. 9
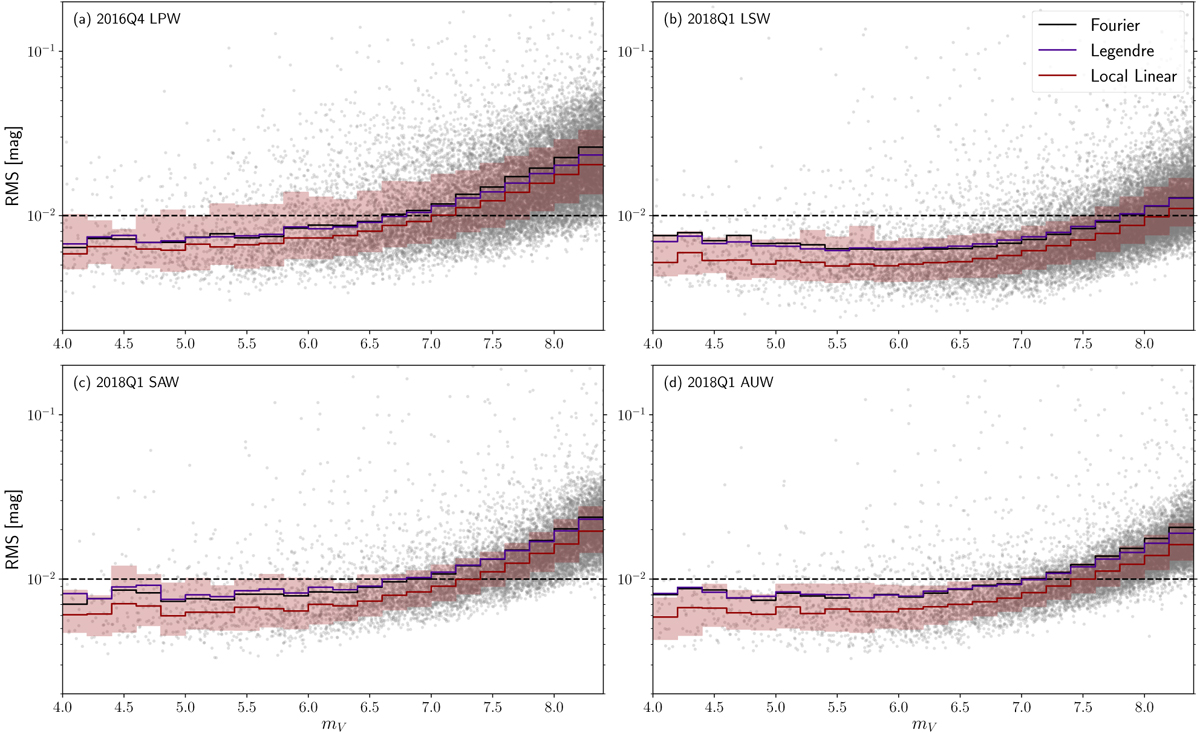
RMS scatter as a function of magnitude for stars observed by the west cameras of each station over the course of a quarter. The curves show the median RMS in bins of 0.2 mag for the three secondary calibration methods. For the Local Linear method the 1σ percentiles (coloured area), and the RMS scatter values of individual stars (grey points) are also indicated. The dashed black line shows the 10 mmag noise level. Only light curves with >500 quarterly data points were used.
Current usage metrics show cumulative count of Article Views (full-text article views including HTML views, PDF and ePub downloads, according to the available data) and Abstracts Views on Vision4Press platform.
Data correspond to usage on the plateform after 2015. The current usage metrics is available 48-96 hours after online publication and is updated daily on week days.
Initial download of the metrics may take a while.