Fig. 6
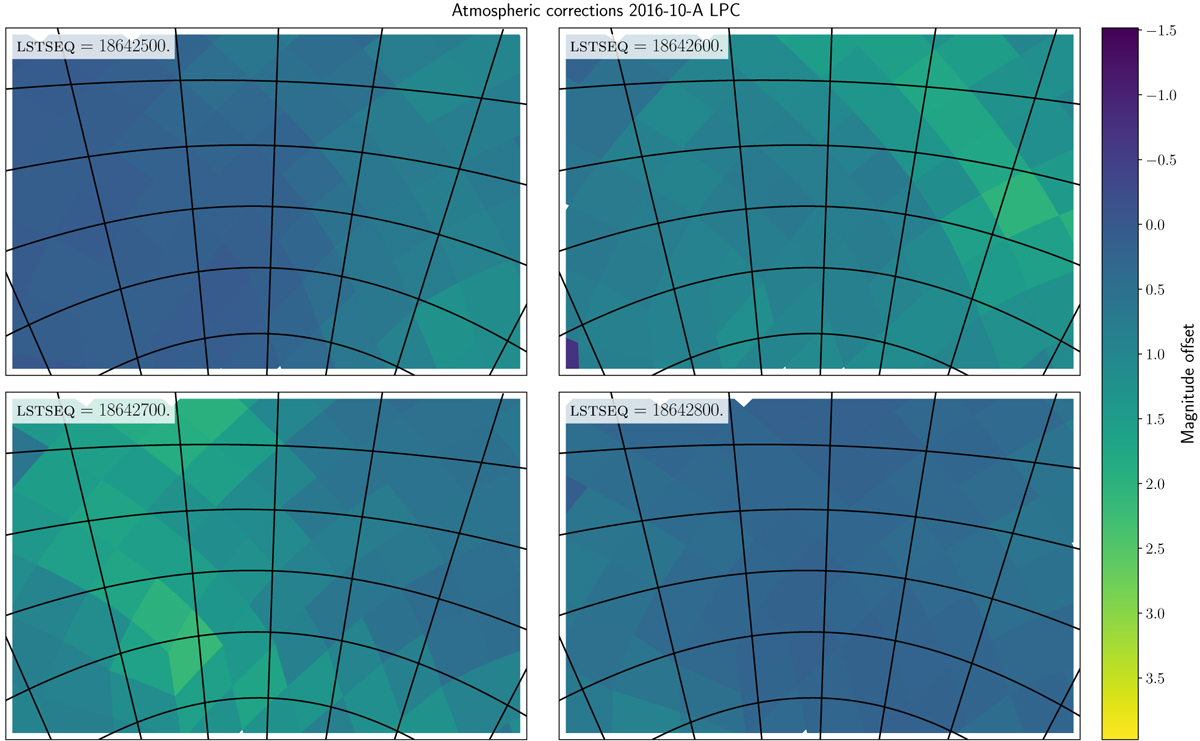
Atmospheric corrections obtained from solving Eq. (2) with all data obtained with the LPC camera during the 2016-10-A baseline. Each panel shows the solution at a different LSTSEQ during the night of 2016-10-08 with an interval of 100 exposures or 640 sidereal seconds. The maps are shown projected onto the CCD and a grid in hour angle and declination is overlaid on top. A movie of the atmospheric corrections during the night of 2016-10-08 is available online.
Current usage metrics show cumulative count of Article Views (full-text article views including HTML views, PDF and ePub downloads, according to the available data) and Abstracts Views on Vision4Press platform.
Data correspond to usage on the plateform after 2015. The current usage metrics is available 48-96 hours after online publication and is updated daily on week days.
Initial download of the metrics may take a while.