Fig. 5
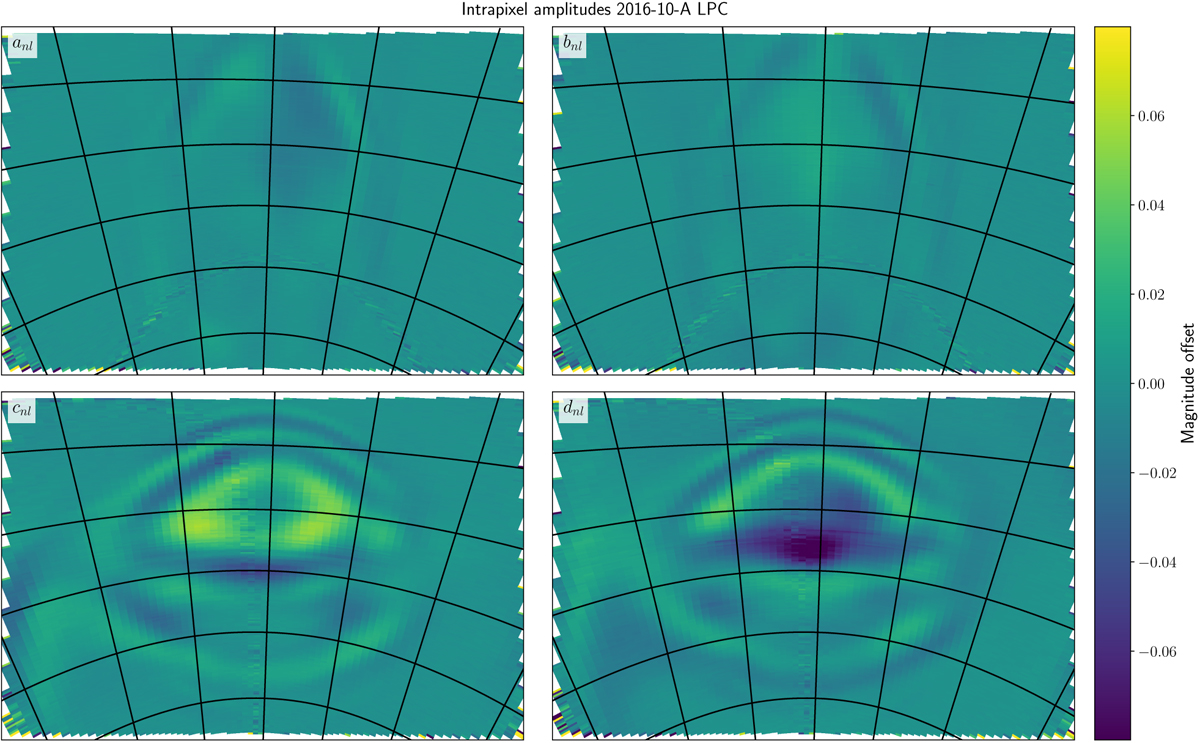
Intrapixel amplitude maps obtained from solving Eq. (2) with all data obtained with theLPC camera during the 2016-10-A baseline. The maps are shown projected onto the CCD and a grid in hour angle and declination is overlaid on top. Top panels: amplitudes anl and bnl of the sin(2πxit) and cos (2πxit) terms. Bottom panels: amplitudes cnl and dnl of the sin(2πyit) and cos (2πyit) terms.
Current usage metrics show cumulative count of Article Views (full-text article views including HTML views, PDF and ePub downloads, according to the available data) and Abstracts Views on Vision4Press platform.
Data correspond to usage on the plateform after 2015. The current usage metrics is available 48-96 hours after online publication and is updated daily on week days.
Initial download of the metrics may take a while.