Fig. 13
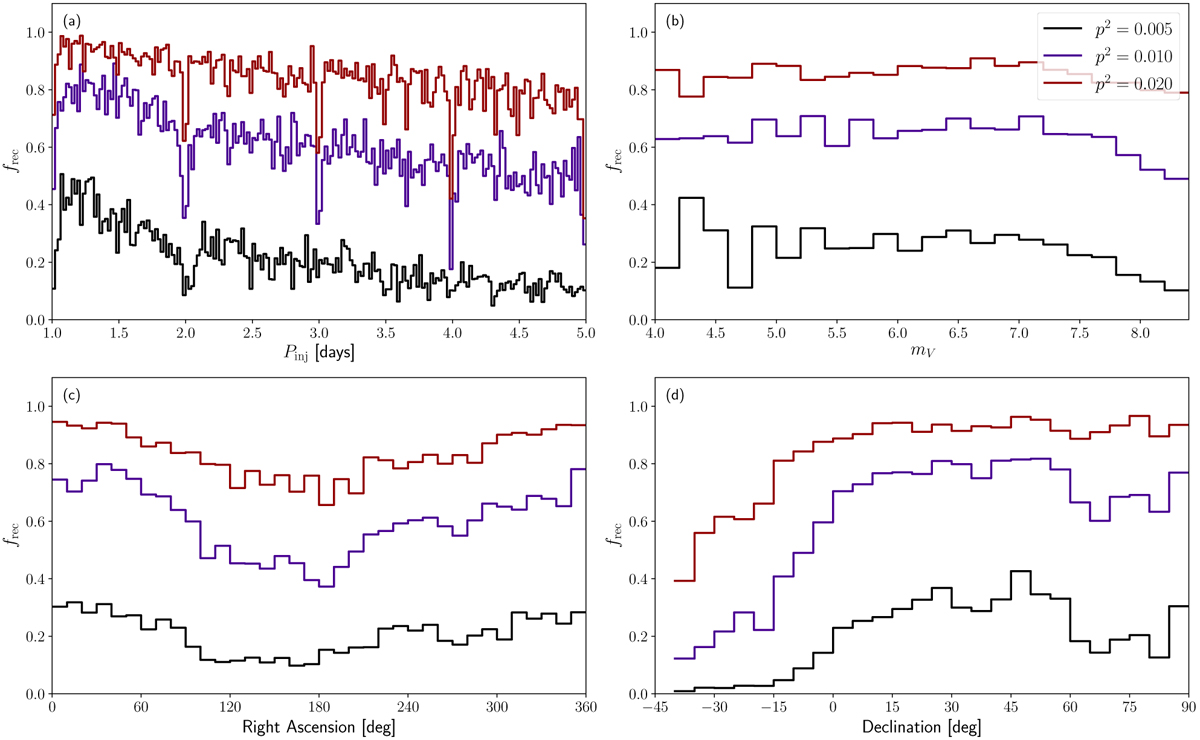
Fraction of transit signals recovered from one year of data from the La Palma station. The curves show the fraction of recovered signals for the different transit depths. The panels show the recovery rates as a function of different parameters: panel a: as a function of the injected period in 192 bins of 0.5 hours, panel b: as a function of the visual magnitude in 22 bins of 0.2 magnitudes, panel c: as a function of the right ascension in 36 bins of 10° and panel d: as a function of the declination in 27 bins of 5°.
Current usage metrics show cumulative count of Article Views (full-text article views including HTML views, PDF and ePub downloads, according to the available data) and Abstracts Views on Vision4Press platform.
Data correspond to usage on the plateform after 2015. The current usage metrics is available 48-96 hours after online publication and is updated daily on week days.
Initial download of the metrics may take a while.