Fig. 10
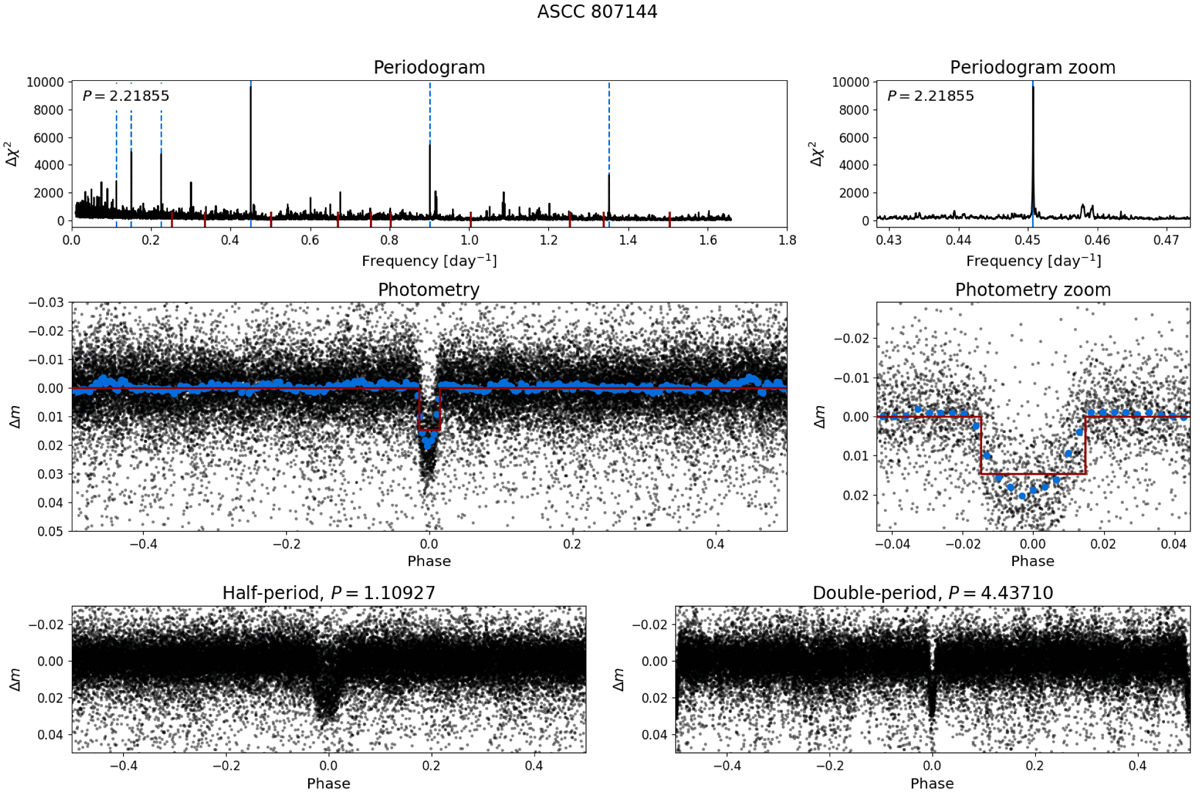
Diagnostic figure showing the results of a transit search run on three years of data from the La Palma station for the star HD 189733. The top row shows the full BLS periodogram (left panel) and a zoom on the peak period (right panel). Bothpanels include the periodogram (black line), lines indicating the peak period and its harmonics (blue dashed lines) and lines indicating the sidereal period and its harmonics (red lines). The middle row shows the full phase-folded light curve (left panel) and a zoom on the transit (right panel), Both panels include the light curve (black dots), the phase-binned light curve (blue points) and the best-fit box model (red line). The bottom row shows the light curve phase-foldedto half the peak period (left panel) and twice the peak period (right panel).
Current usage metrics show cumulative count of Article Views (full-text article views including HTML views, PDF and ePub downloads, according to the available data) and Abstracts Views on Vision4Press platform.
Data correspond to usage on the plateform after 2015. The current usage metrics is available 48-96 hours after online publication and is updated daily on week days.
Initial download of the metrics may take a while.