Fig. 5.
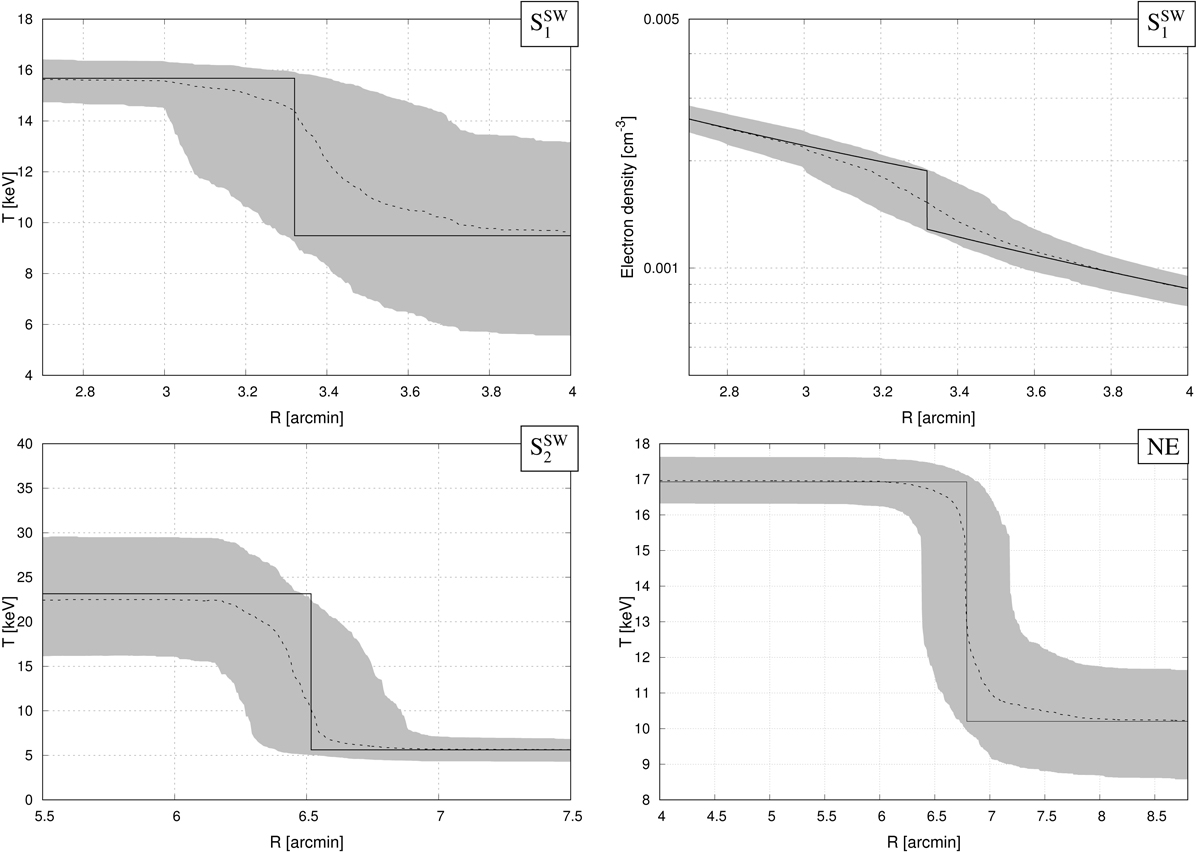
Deprojected temperature and electron density profiles around the shock regions for the NE and SW directions. Solid lines correspond to the deprojected profiles, and gray shaded areas show the 68% confidence intervals estimated from 1000 Monte-Carlo realizations. The dashed lines show the median of all realizations. For details of the shock properties see Table 2. Top row: deprojected temperature (left) and density (right) profile around the jump position for the inner shock in the SW direction. Bottom left: deprojected temperature profile in the shock region for the outer shock in the SW direction. The profile slightly exceeds the 68% interval at the jump position because of the sharp discontinuity, which is smeared out in the MC realizations. Bottom right: deprojected temperature profile in the NE direction around the shock position.
Current usage metrics show cumulative count of Article Views (full-text article views including HTML views, PDF and ePub downloads, according to the available data) and Abstracts Views on Vision4Press platform.
Data correspond to usage on the plateform after 2015. The current usage metrics is available 48-96 hours after online publication and is updated daily on week days.
Initial download of the metrics may take a while.