Fig. 3.
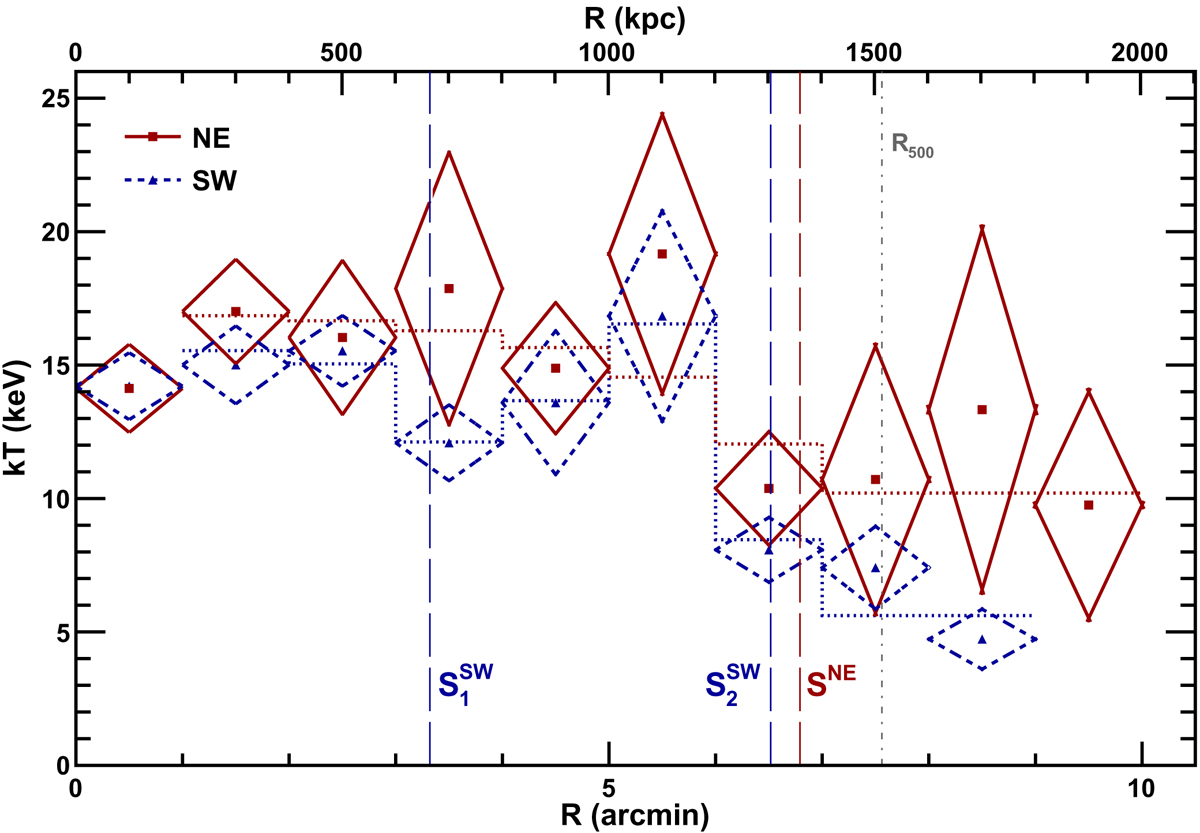
Projected, PSF-corrected Suzaku temperature profiles of A2163 obtained in NE (solid red diamonds) and SW (dashed blue diamonds) direction. The vertical dashed lines show the jump positions of the detected shocks as obtained from our deprojection procedure while dotted lines correspond to the projected best-fit temperature models (see Sect. 3.2.4 for details about the deprojection). The gray vertical dotdashed line indicates R500, as obtained by Radovich et al. (2008) from a weak-lensing analysis.
Current usage metrics show cumulative count of Article Views (full-text article views including HTML views, PDF and ePub downloads, according to the available data) and Abstracts Views on Vision4Press platform.
Data correspond to usage on the plateform after 2015. The current usage metrics is available 48-96 hours after online publication and is updated daily on week days.
Initial download of the metrics may take a while.