Fig. 5.
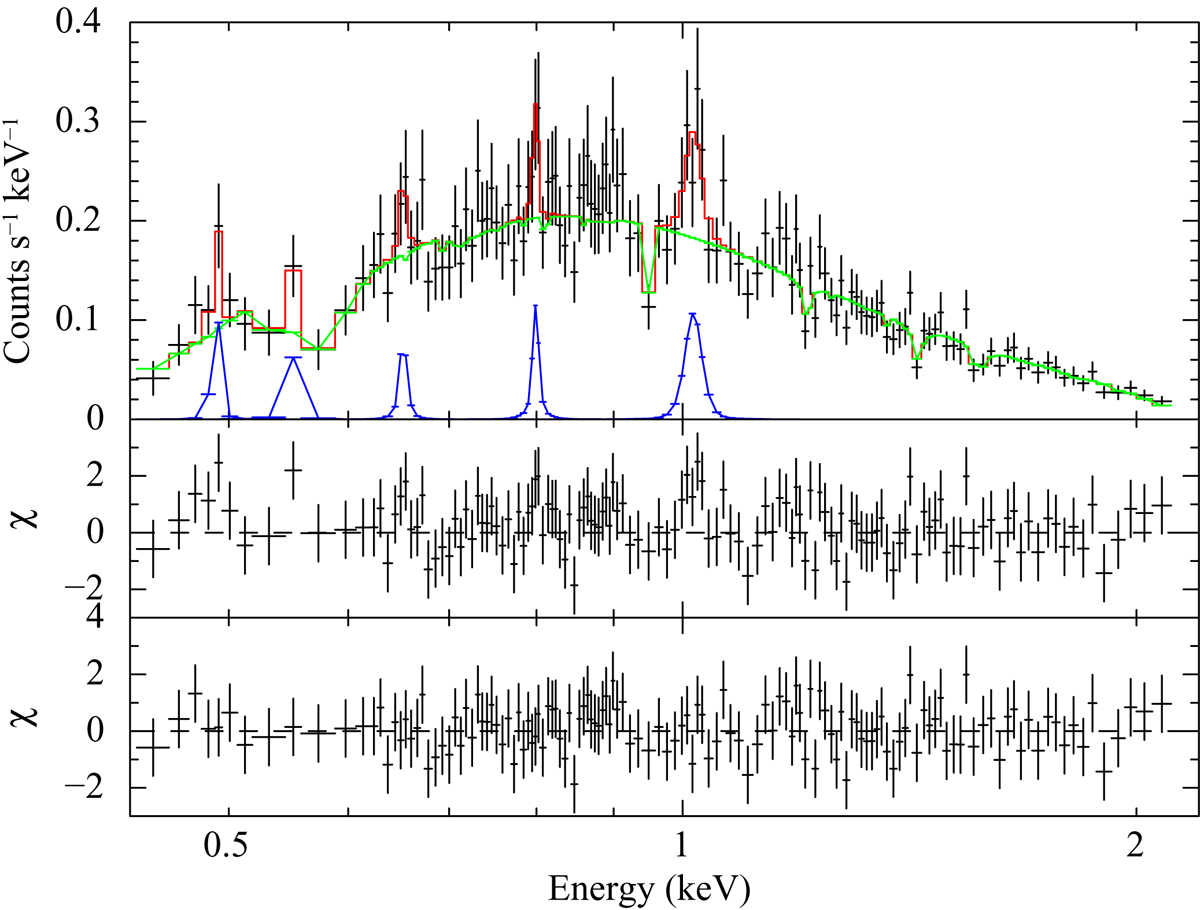
Combined spectrum for the first-order data of RGS1 and RGS2. Upper panel: superposition of the spectrum with the best-fitting model composed by an absorbed power-law (green line) and additional Gaussian components (blues lines, Table 3). Middle panel: data-model residuals obtained when fitting the spectrum with a simple power-law model. Lower panel: data-model residuals obtained with the best-fitting model (power-law plus Gaussian components).
Current usage metrics show cumulative count of Article Views (full-text article views including HTML views, PDF and ePub downloads, according to the available data) and Abstracts Views on Vision4Press platform.
Data correspond to usage on the plateform after 2015. The current usage metrics is available 48-96 hours after online publication and is updated daily on week days.
Initial download of the metrics may take a while.