Fig. 4.
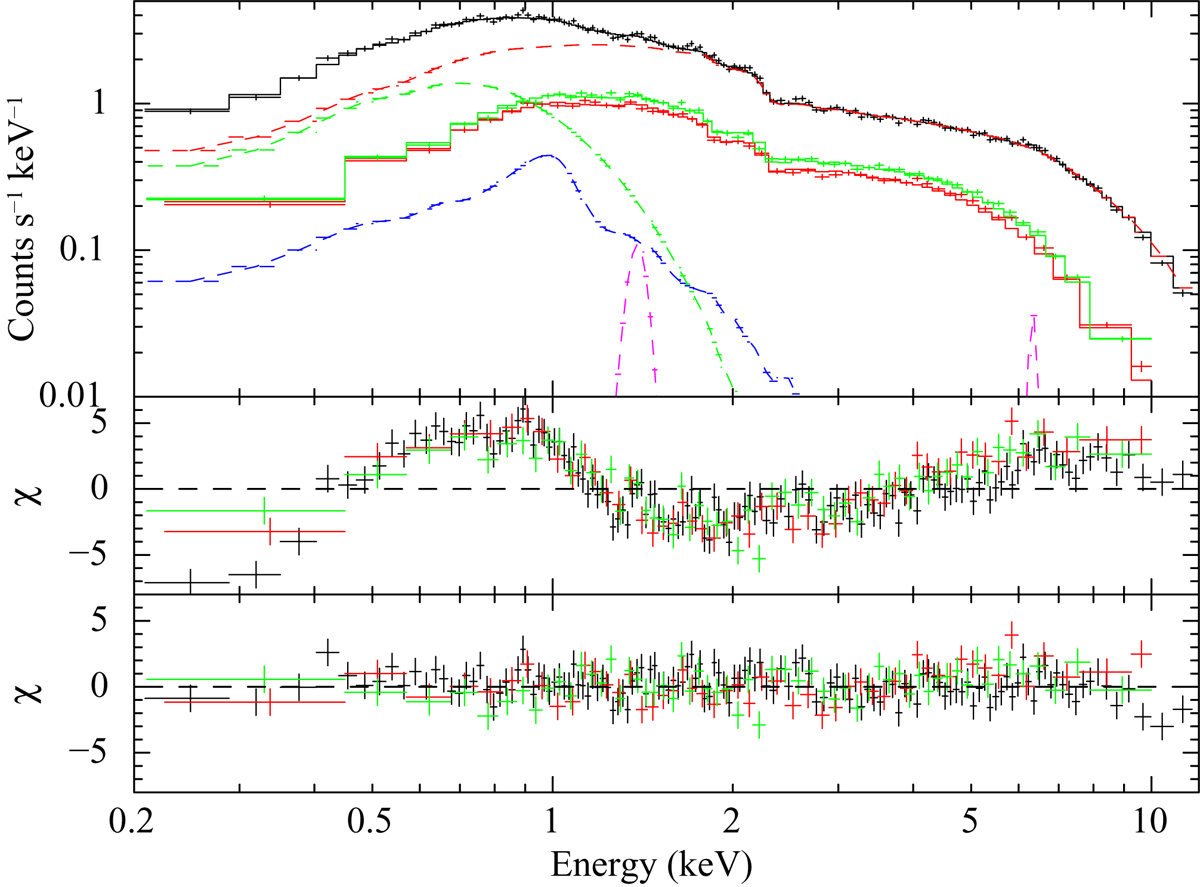
Time-averaged spectrum of SXP59.0. Black, red, and green symbols respectively represent pn, MOS1, and MOS2 data. Upper panel: superposition of the EPIC spectra with (for the pn spectrum only) the best-fitting model composed of pl + bb + apec (red, green, and blue dashed lines, respectively) and the Gaussian components (magenta dashed lines). Middle panel: data-model residuals obtained when fitting the spectra with a simple pl model. Lower panel: data-model residuals obtained with the best-fitting model.
Current usage metrics show cumulative count of Article Views (full-text article views including HTML views, PDF and ePub downloads, according to the available data) and Abstracts Views on Vision4Press platform.
Data correspond to usage on the plateform after 2015. The current usage metrics is available 48-96 hours after online publication and is updated daily on week days.
Initial download of the metrics may take a while.