Open Access
Fig. 4.
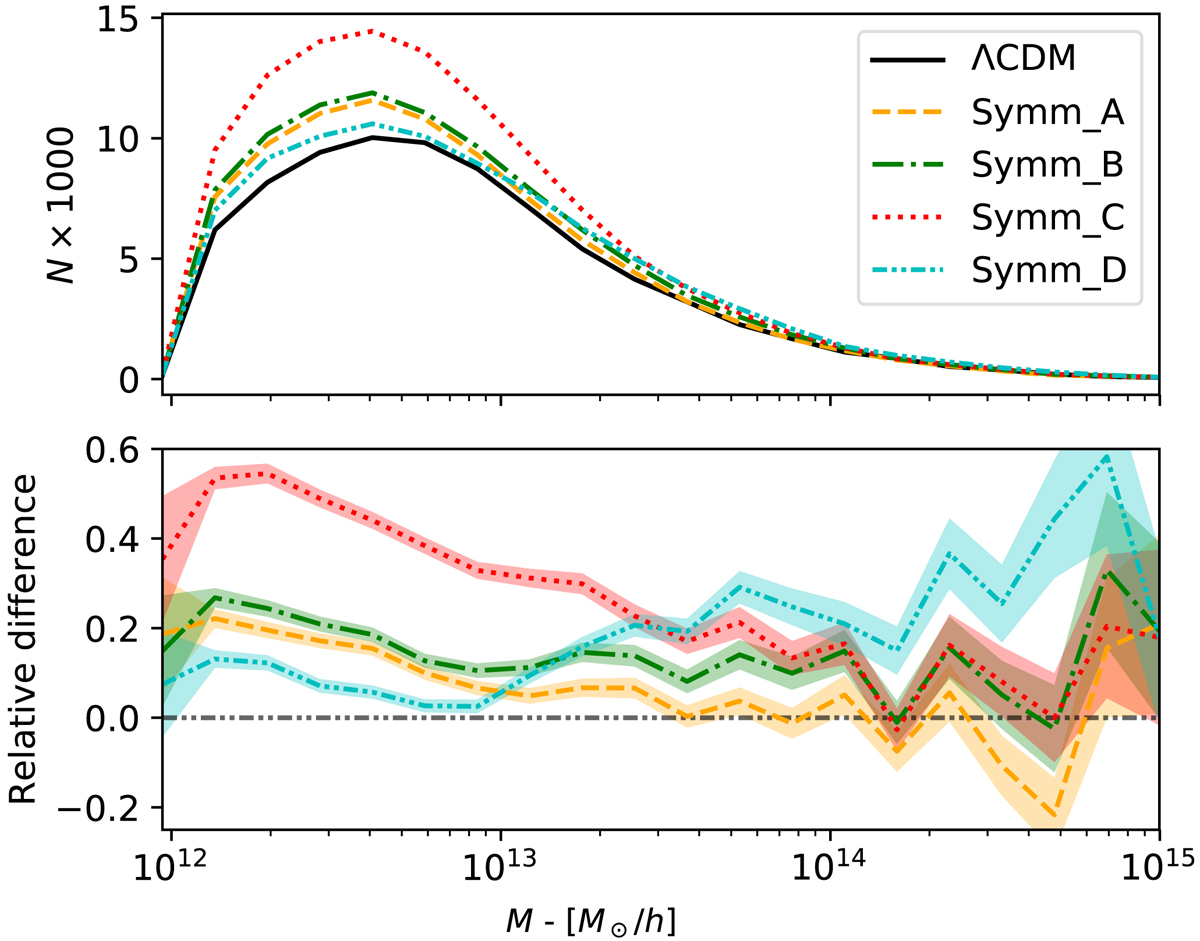
Filament mass distributions of the symmetron and ΛCDM models (top panel) and the relative difference with respect to ΛCDM (bottom panel). The histograms are computed over 20 logarithmically distributed bins.
Current usage metrics show cumulative count of Article Views (full-text article views including HTML views, PDF and ePub downloads, according to the available data) and Abstracts Views on Vision4Press platform.
Data correspond to usage on the plateform after 2015. The current usage metrics is available 48-96 hours after online publication and is updated daily on week days.
Initial download of the metrics may take a while.