Open Access
Fig. 11.
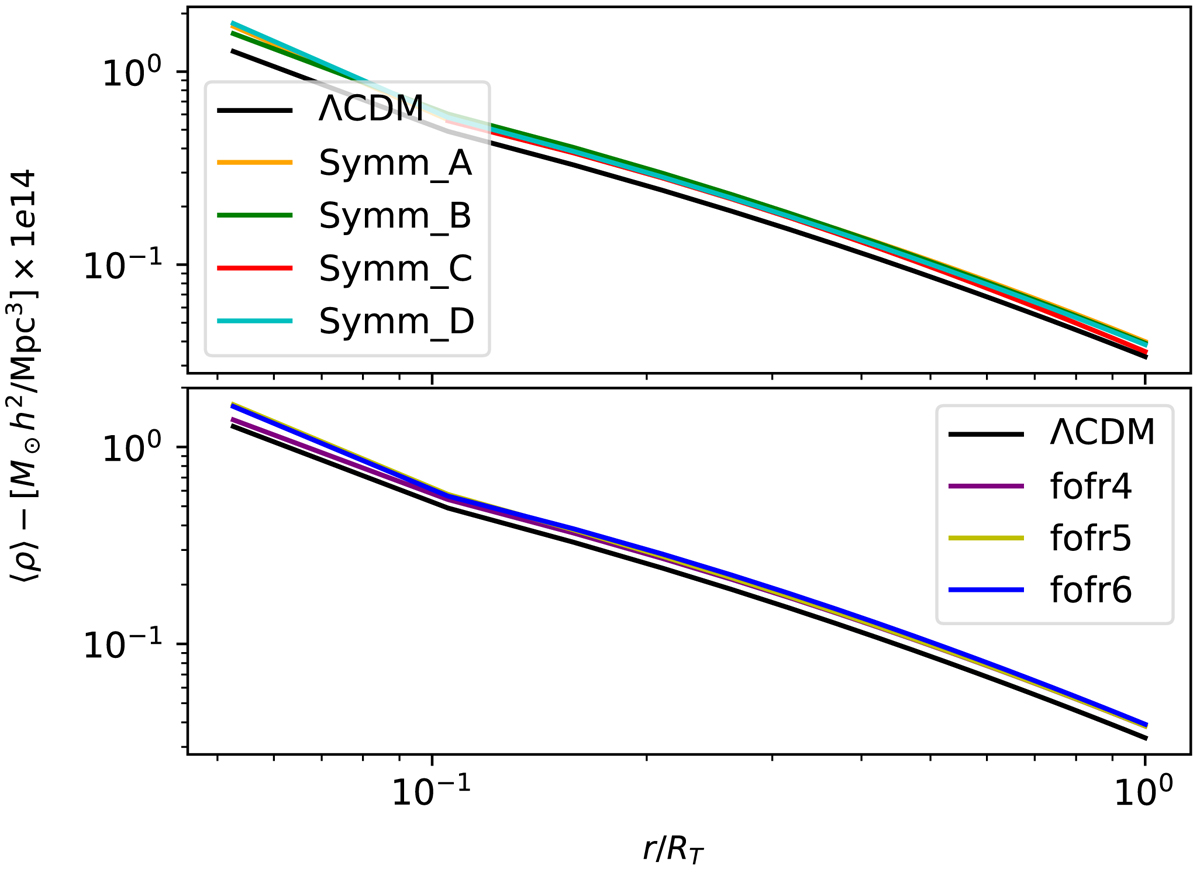
Average density profiles of all filaments in each model. On average, the filaments have a higher density near their centers and lower near their outermost radii. The average density is computed as a function of the normalized radius, r/RT.
Current usage metrics show cumulative count of Article Views (full-text article views including HTML views, PDF and ePub downloads, according to the available data) and Abstracts Views on Vision4Press platform.
Data correspond to usage on the plateform after 2015. The current usage metrics is available 48-96 hours after online publication and is updated daily on week days.
Initial download of the metrics may take a while.