Fig. 9.
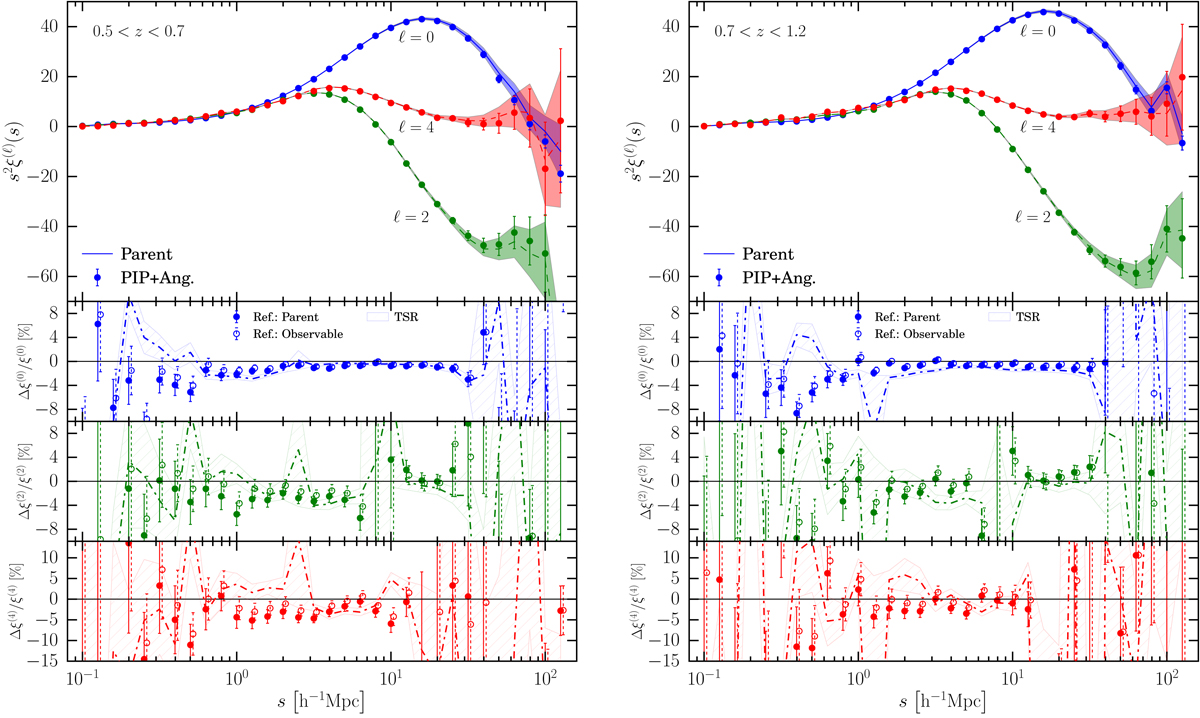
Top panels: mean estimates and related errors of multipole moments of the two-point correlation function from the set of 153 mock parent samples (lines with shaded bands) and the corresponding VIPERS-like mocks obtained using the PIP and angular up-weighting method (points with error-bars). Bottom panels: mean fractional systematic bias of measurements from VIPERS-like mocks with respect to the ones from the underlying parent samples (filled points with solid error-bars). In the bottom small panels we also display the case when the sub-sample of observable pairs is used as reference (empty markers with dashed error-bars). Measurements obtained using the TSR weighting scheme are plotted for comparison (dash-dotted lines with hatched areas). Error bars in the bottom panels quantify the scatter of the systematic offsets among 153 mocks. Left and right panels show the measurements in the low 0.5 < z < 0.7 and high 0.7 < z < 1.2 redshift bins, respectively.
Current usage metrics show cumulative count of Article Views (full-text article views including HTML views, PDF and ePub downloads, according to the available data) and Abstracts Views on Vision4Press platform.
Data correspond to usage on the plateform after 2015. The current usage metrics is available 48-96 hours after online publication and is updated daily on week days.
Initial download of the metrics may take a while.