Fig. 8.
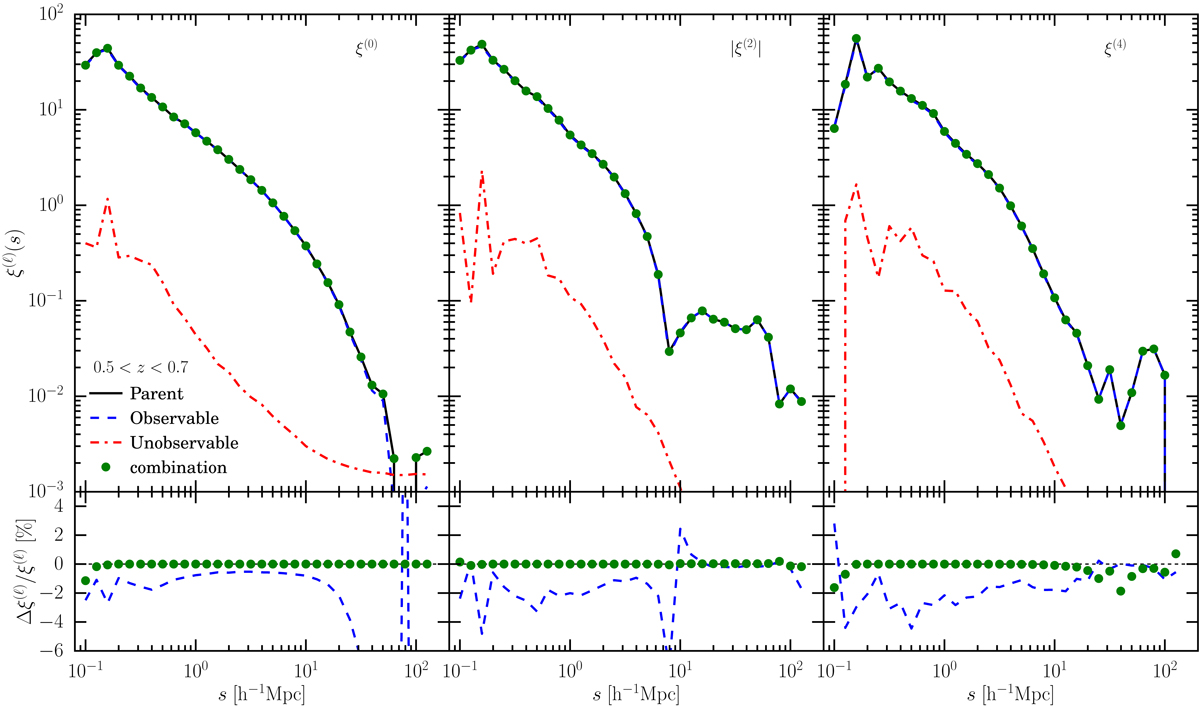
Top panels: multipole moments measured from one mock parent catalogue (black continuous lines). The contribution to the overall clustering from the sub-samples of observable (blue dashed lines) and unobservable (red dash-dotted lines) pairs (defined respectively as those targeted at least once and the ones never targeted in the ensemble of 2170 targeting runs) as written in Eq. (16) are also shown. The combination of these two contributions is plotted as green filled markers. Bottom panels: fractional offset of the contribution from observable pairs and the unobservable/observable combination with respect to the reference measurement from the parent mock. This measurement refers to the low-redshift bin 0.5 < z < 0.7. The measurement in the high-redshift bin 0.7 < z < 1.2 shows a very similar behaviour.
Current usage metrics show cumulative count of Article Views (full-text article views including HTML views, PDF and ePub downloads, according to the available data) and Abstracts Views on Vision4Press platform.
Data correspond to usage on the plateform after 2015. The current usage metrics is available 48-96 hours after online publication and is updated daily on week days.
Initial download of the metrics may take a while.