Fig. 7.
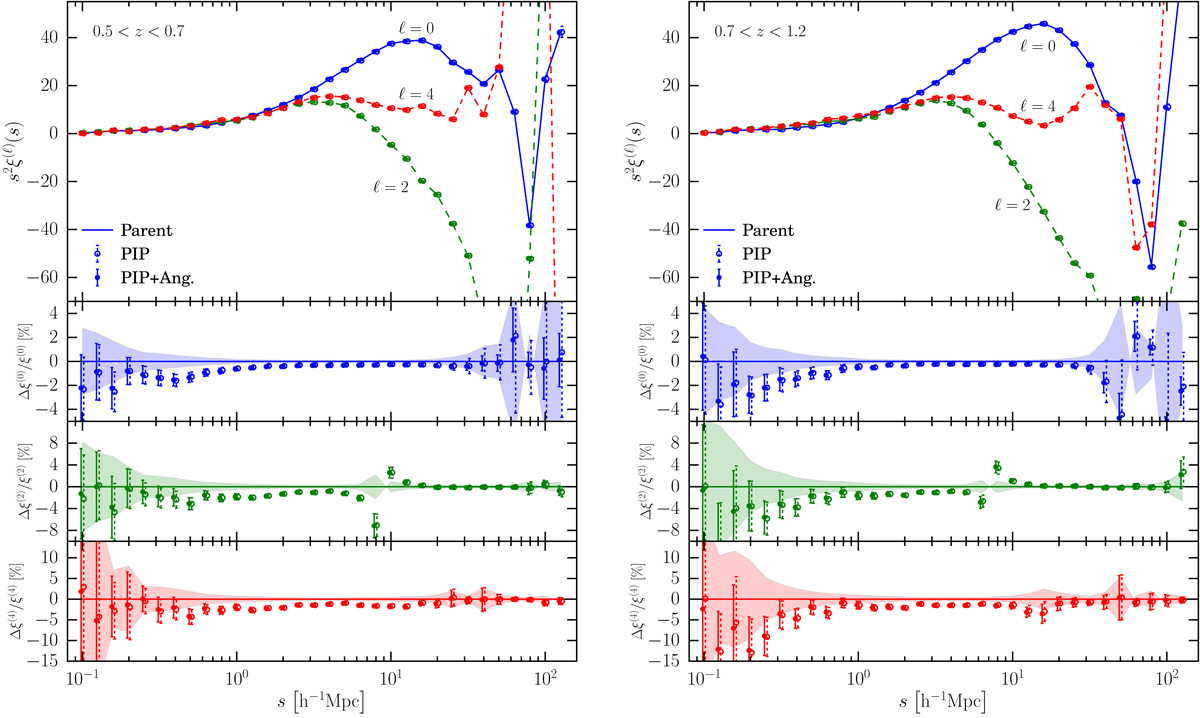
Top large panels: measurements of the first three even multipoles of the two-point correlation function from one reference mock parent sample (lines). Points with error bars show the mean and related errors among 2170 measurements obtained using the PIP weighting scheme alone (empty markers, dashed error bars) and when supplemented with an angular up-weighting (filled markers, continuous error bars) on independent survey realisations drawn from the same mock parent sample. Bottom small panels: empty and filled markers display the fractional systematic bias of the corresponding measurements in the top large panels with respect to that from the reference mock parent sample. The horizontal continuous coloured lines and the shaded bands show the equivalent of the empty markers in the same panels but when the reference sample is limited to the galaxies and galaxy pairs that are targeted at least once in the 2170 survey realisations. Error bars in the bottom panels are obtained using the standard error propagation formula. Left and right panels show results from the lower- and higher-redshift bins, respectively. All measurements use data from W1 and W4 (mock) fields.
Current usage metrics show cumulative count of Article Views (full-text article views including HTML views, PDF and ePub downloads, according to the available data) and Abstracts Views on Vision4Press platform.
Data correspond to usage on the plateform after 2015. The current usage metrics is available 48-96 hours after online publication and is updated daily on week days.
Initial download of the metrics may take a while.