Fig. 5.
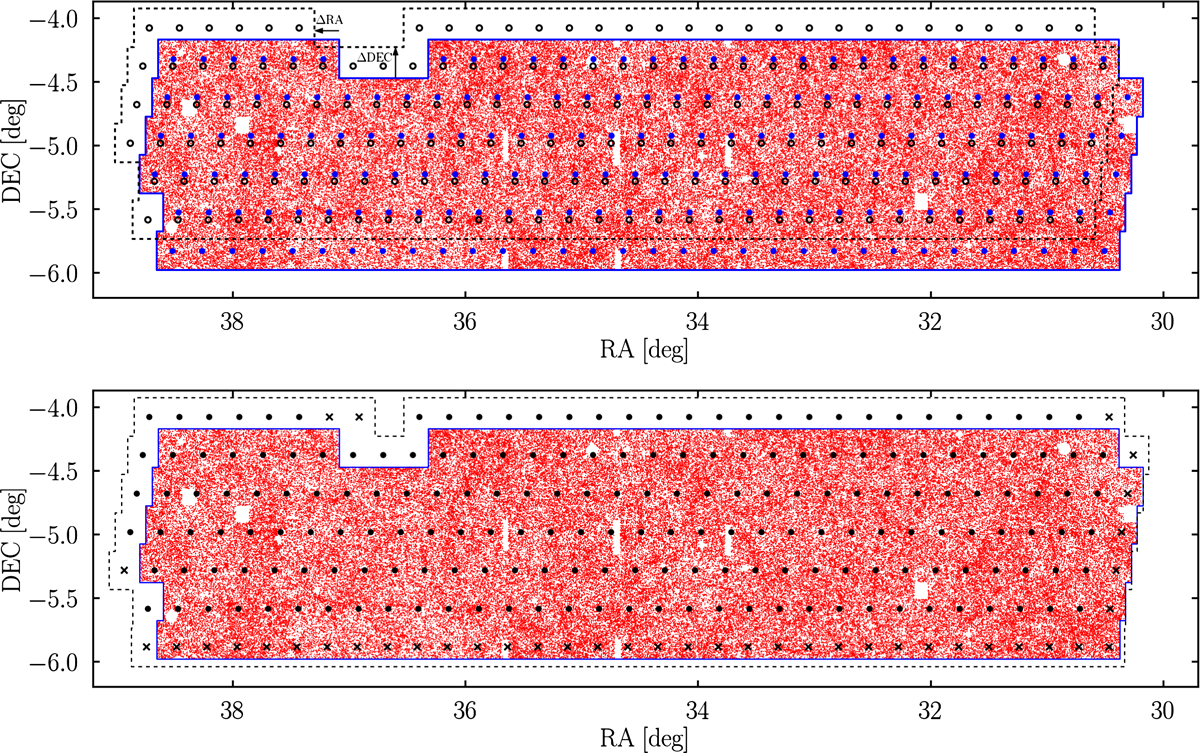
Top panel: sketch showing the border effects when multiple survey realisations are generated shifting the original VIPERS spectroscopic mask over the underlying parent catalogue (red dots). The area covered by the actual VIPERS spectroscopic mask is delimited by the blue continuous line while the corresponding VIMOS pointings are displayed as blue filled dots. A random shift of (ΔRA, ΔDec) is then applied to obtain a new survey realisation. The area covered in the new realisation is shown as black dashed contour with black empty circles being the new positions of VIMOS pointings. We highlight the portion of the parent catalogues at low RA and low Dec that is not covered by the shifted mask. The effect is even more severe for the realisations obtained rotating the underlying parent catalogue. Bottom panel: as in the top panel but here the new survey realisation is generated shifting the “extended” spectroscopic mask (see Sect. 5). Black dots show the shifted position of the pointings in the original VIPERS spectroscopic mask while the black crosses represent the “artificial” pointings in the extended spectroscopic mask. The extended mask is large enough to fully cover also the parent catalogue rotated by 90°, 180°, or 270°. In both panels a number of pointings in the shifted mask are located outside the boundaries of the parent sample. These are the pointings that only partially overlap with the parent catalogue.
Current usage metrics show cumulative count of Article Views (full-text article views including HTML views, PDF and ePub downloads, according to the available data) and Abstracts Views on Vision4Press platform.
Data correspond to usage on the plateform after 2015. The current usage metrics is available 48-96 hours after online publication and is updated daily on week days.
Initial download of the metrics may take a while.