Fig. 1.
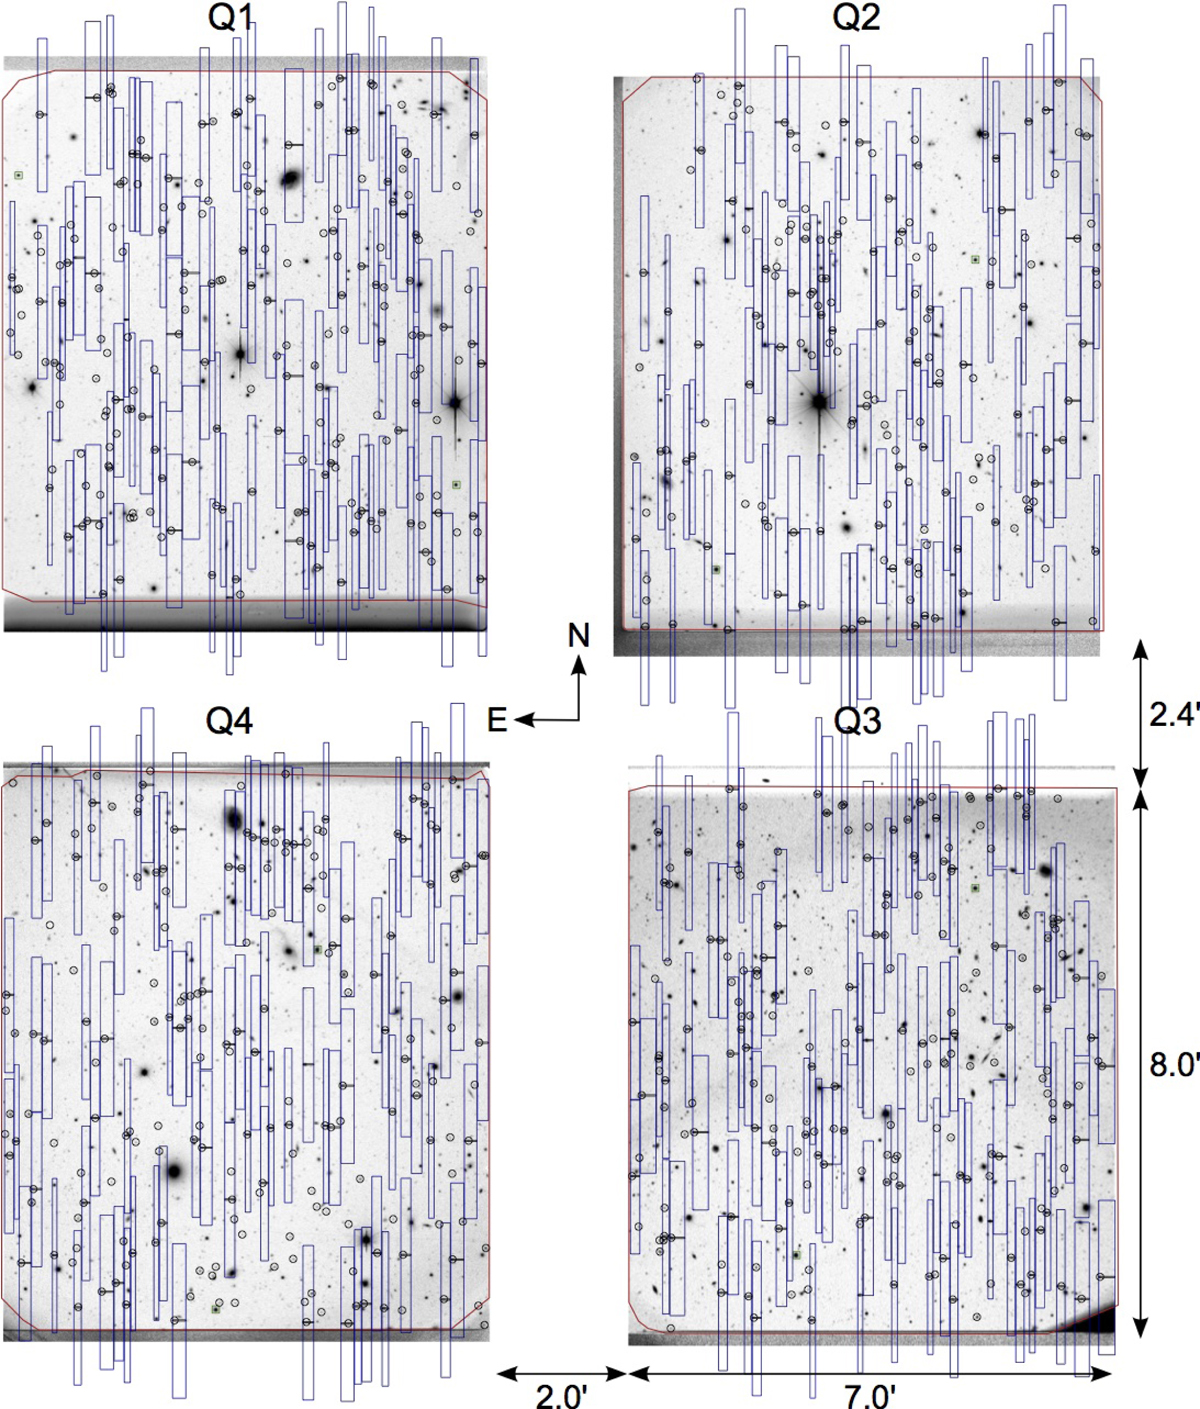
Example of the slit/spectrum distribution over a full VIMOS pointing, showing the disposition of the four quadrants and the “cross” among them. The circles identify the targets selected by the SPOC optimisation algorithm. The elongated blue rectangles reproduce the “shadow” of the 2D spectrum that will result from each target in the final spectroscopic exposure. The thin red lines show the boundary of the actual spectroscopic mask, traced pointing-by-pointing through an automatic detection algorithm that follows the borders of the illuminated area (see Guzzo et al. 2014, for details)
Current usage metrics show cumulative count of Article Views (full-text article views including HTML views, PDF and ePub downloads, according to the available data) and Abstracts Views on Vision4Press platform.
Data correspond to usage on the plateform after 2015. The current usage metrics is available 48-96 hours after online publication and is updated daily on week days.
Initial download of the metrics may take a while.