Fig. 3.
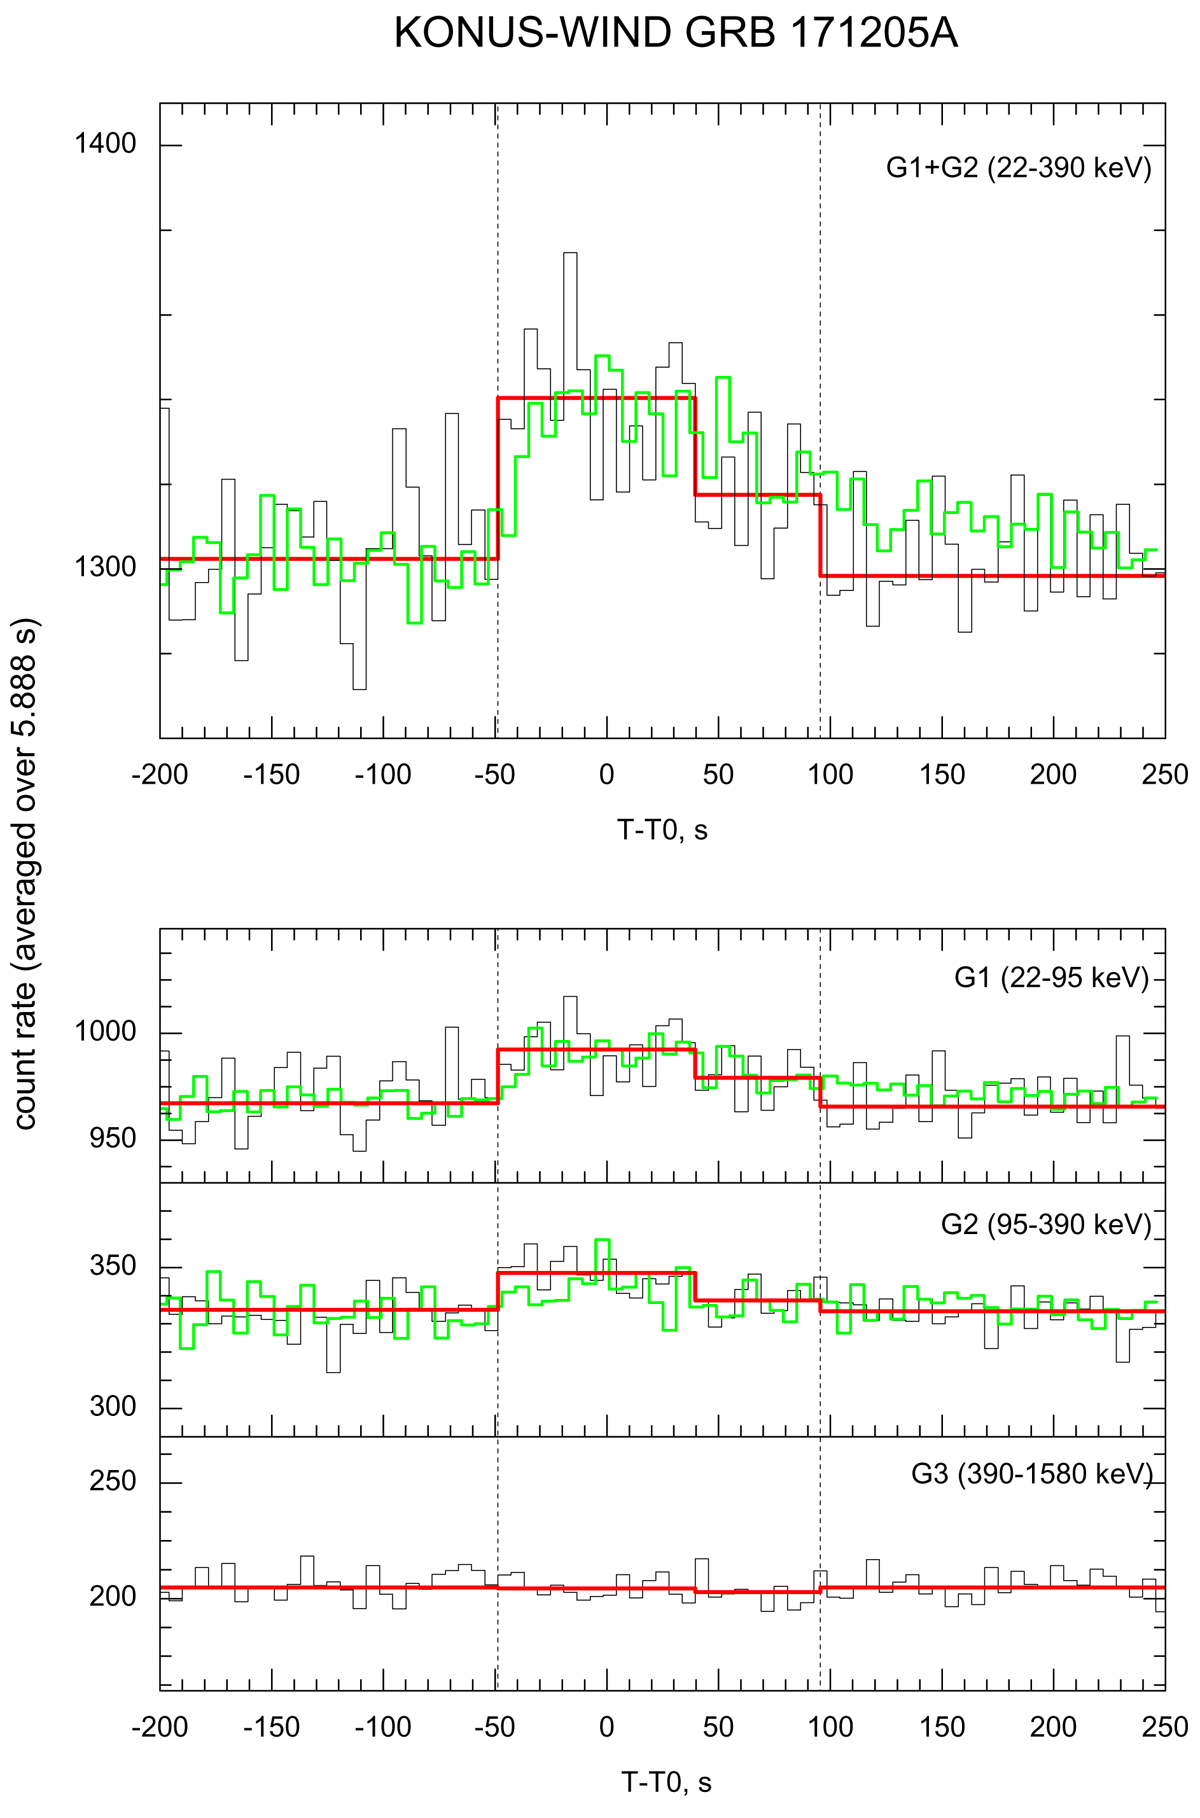
Konus-Wind observation of GRB 171205A in G1+G2, G1, G2, and G3 bands (top to bottom, black lines). Red lines show the results of the Bayesian block analysis in the G1+G2 band. The Swift/BAT light curves in corresponding energy bands are shown for reference (green lines), shifted and scaled to match the KW light curves. The vertical dashed lines denote the data interval chosen for the joint KW+BAT spectral analysis.
Current usage metrics show cumulative count of Article Views (full-text article views including HTML views, PDF and ePub downloads, according to the available data) and Abstracts Views on Vision4Press platform.
Data correspond to usage on the plateform after 2015. The current usage metrics is available 48-96 hours after online publication and is updated daily on week days.
Initial download of the metrics may take a while.