Fig. 9.
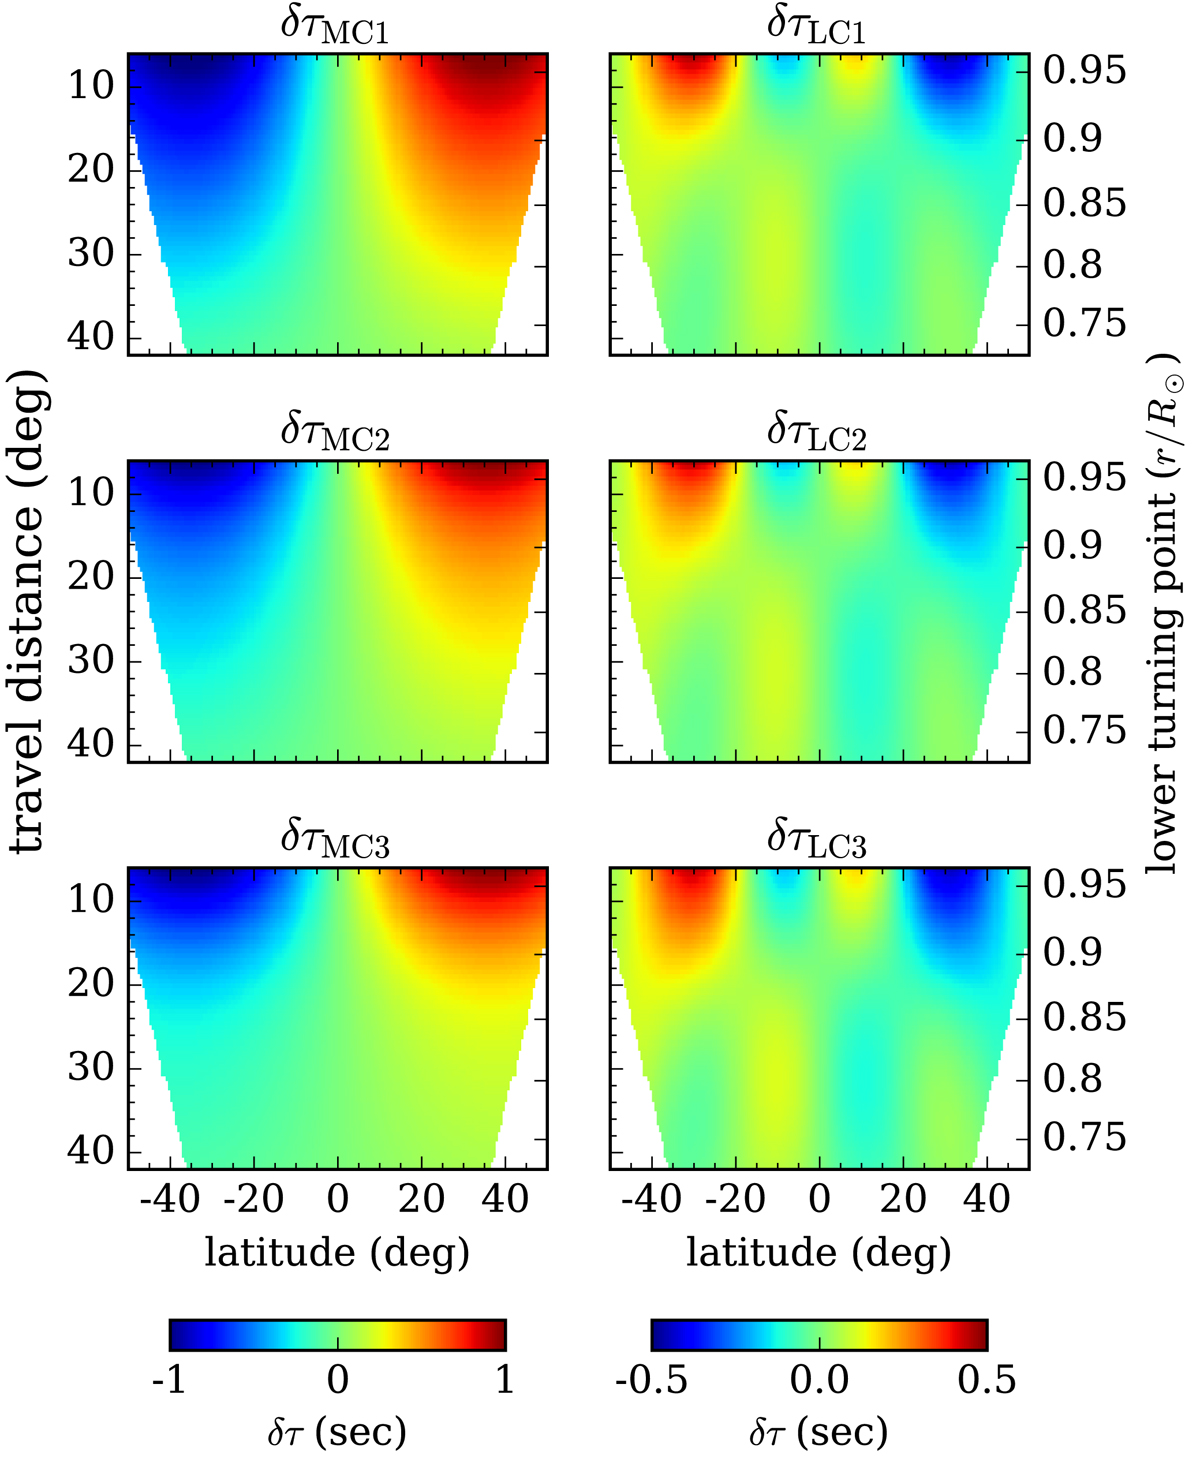
Ray-approximation travel-time shifts for the MC (left column) and LC (right column) flow models as a function of latitude and distance. The parts for which we do not make measurements are not shown in these maps. The color scale for each column is shown in the color bar at the bottom. The corresponding radii of the lower turning points are indicated on the right.
Current usage metrics show cumulative count of Article Views (full-text article views including HTML views, PDF and ePub downloads, according to the available data) and Abstracts Views on Vision4Press platform.
Data correspond to usage on the plateform after 2015. The current usage metrics is available 48-96 hours after online publication and is updated daily on week days.
Initial download of the metrics may take a while.