Fig. 6.
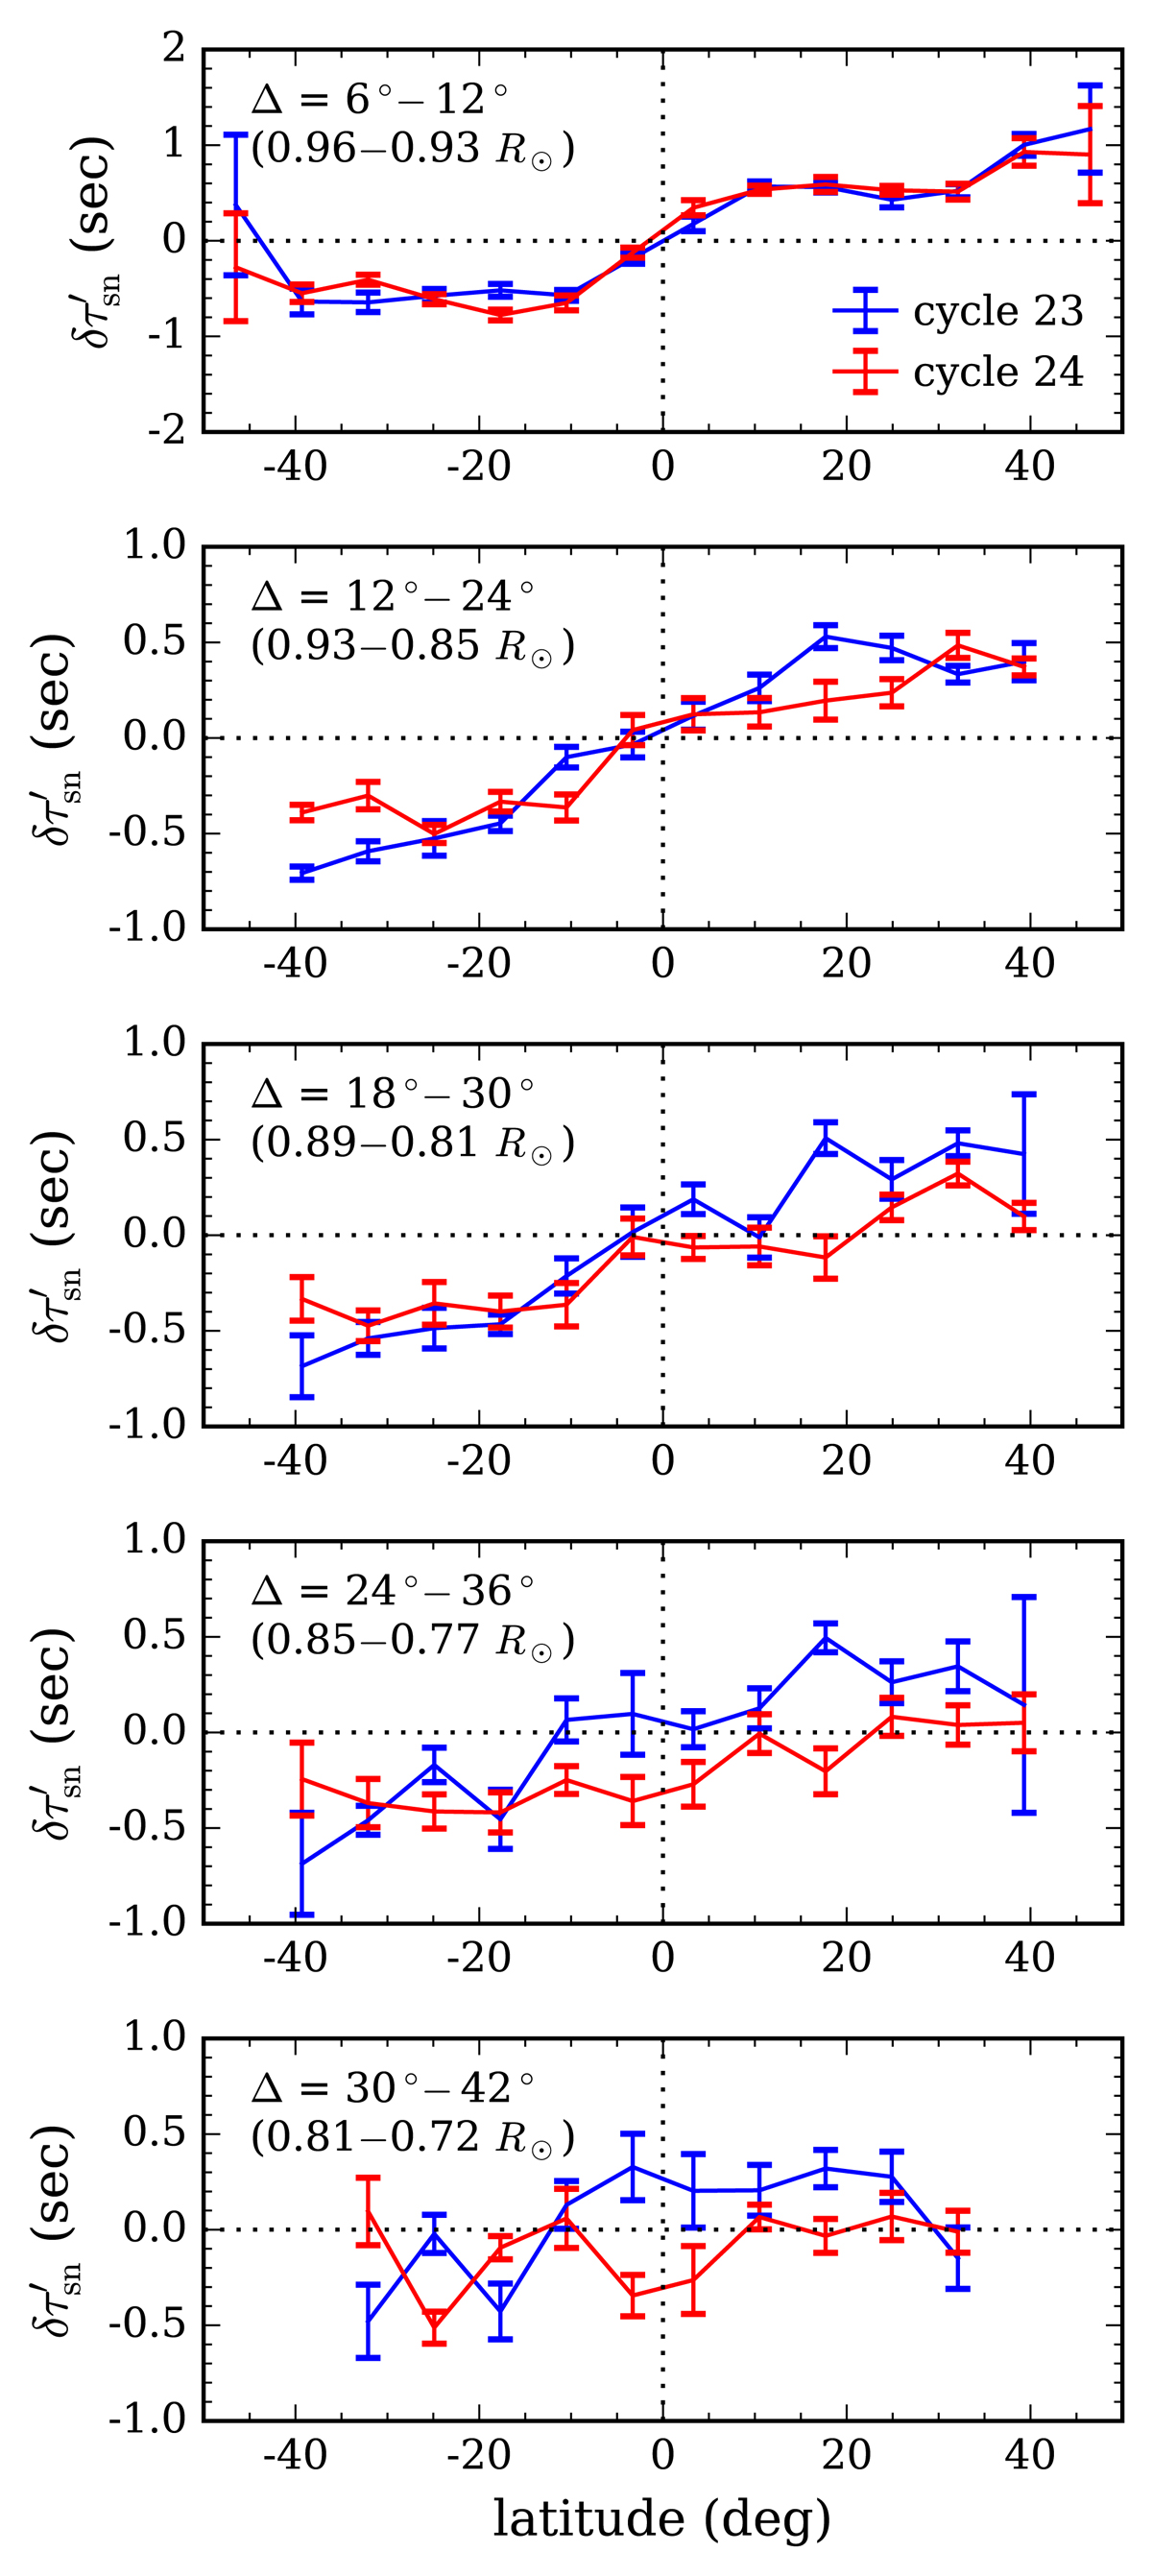
Measured δτ′sn for cycle 23 (blue) and cycle 24 (red), averaged over five distance ranges, as a function of latitude. The time periods are May 1996 to April 2008 for cycle 23 and May 2008 to April 2017 for cycle 24. The distance ranges, as well as the corresponding radii of the lower turning points from ray approximation, are indicated in the upper left corner of each panel; shortest at the top and largest at the bottom. The data values are binned every 7.2° in latitude. The error bars give the standard deviation of the mean in each binning interval. We note that if we average the data over periods of seven years that cover the first halves of cycle 23 (May 1996 to April 2003; 2191 days used) and cycle 24 (May 2008 to April 2015; 2142 days used), we find essentially the same curves as shown here, however with a higher noise level.
Current usage metrics show cumulative count of Article Views (full-text article views including HTML views, PDF and ePub downloads, according to the available data) and Abstracts Views on Vision4Press platform.
Data correspond to usage on the plateform after 2015. The current usage metrics is available 48-96 hours after online publication and is updated daily on week days.
Initial download of the metrics may take a while.