Fig. 13.
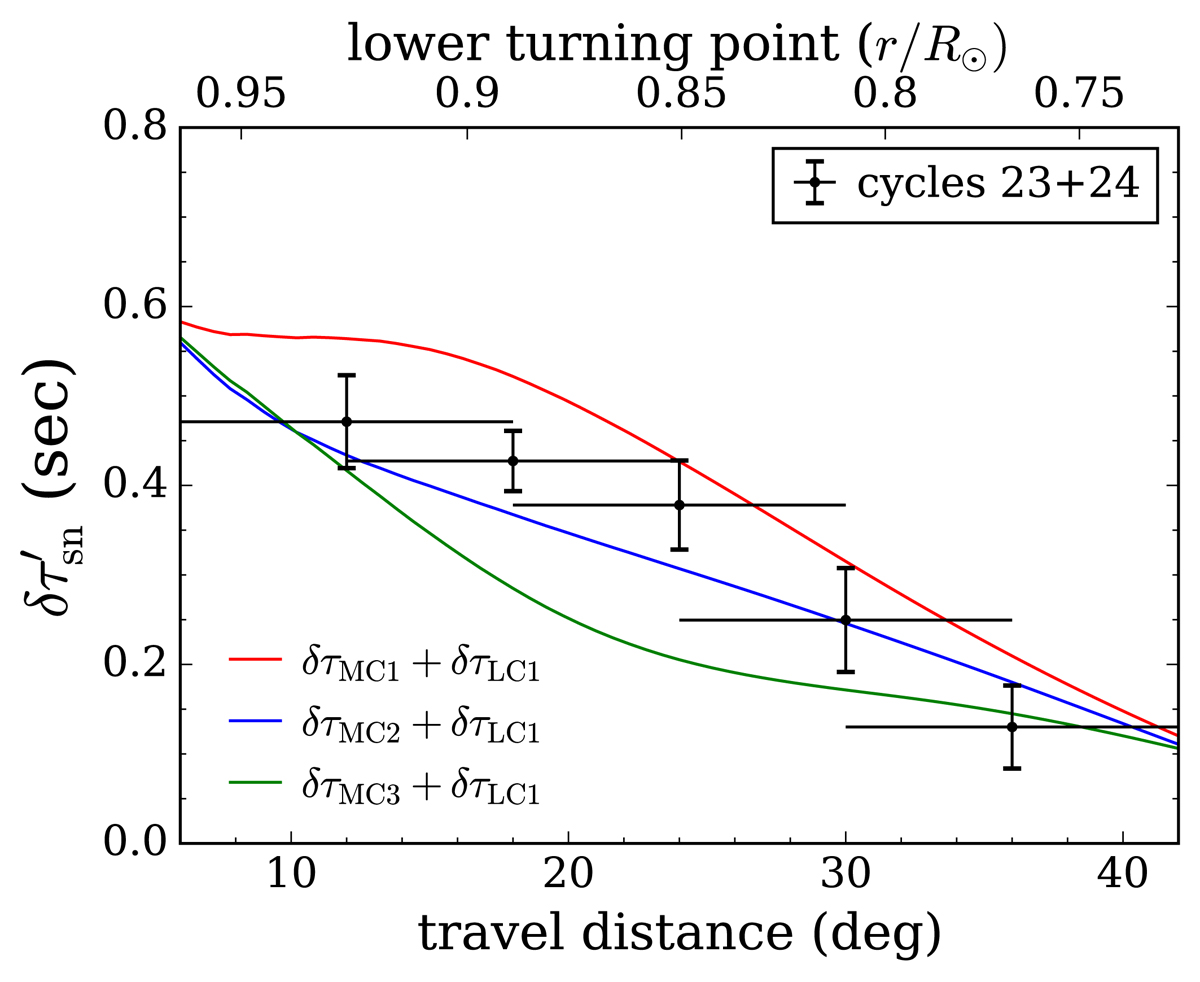
Comparison of the 21-yr averaged travel-time shifts and the forward-modeled results as a function of distance. The data points with error bars are the δτ′sn;23+24 antisymmetrized about the equator and averaged over the latitude range 20°–35° north as a function of distance. The horizontal bar associated with each point represents the distance range over which the mean value and the standard deviation of the mean are computed. The colored curves (see legend) indicate the selected forward-modeled travel-time shifts averaged over the same latitudinal range as for the δτ′sn;23+24. The models MC1 and MC2 are two varieties of single-cell flow models whereas the model MC3 has a double-cell structure (see Fig. 8).
Current usage metrics show cumulative count of Article Views (full-text article views including HTML views, PDF and ePub downloads, according to the available data) and Abstracts Views on Vision4Press platform.
Data correspond to usage on the plateform after 2015. The current usage metrics is available 48-96 hours after online publication and is updated daily on week days.
Initial download of the metrics may take a while.