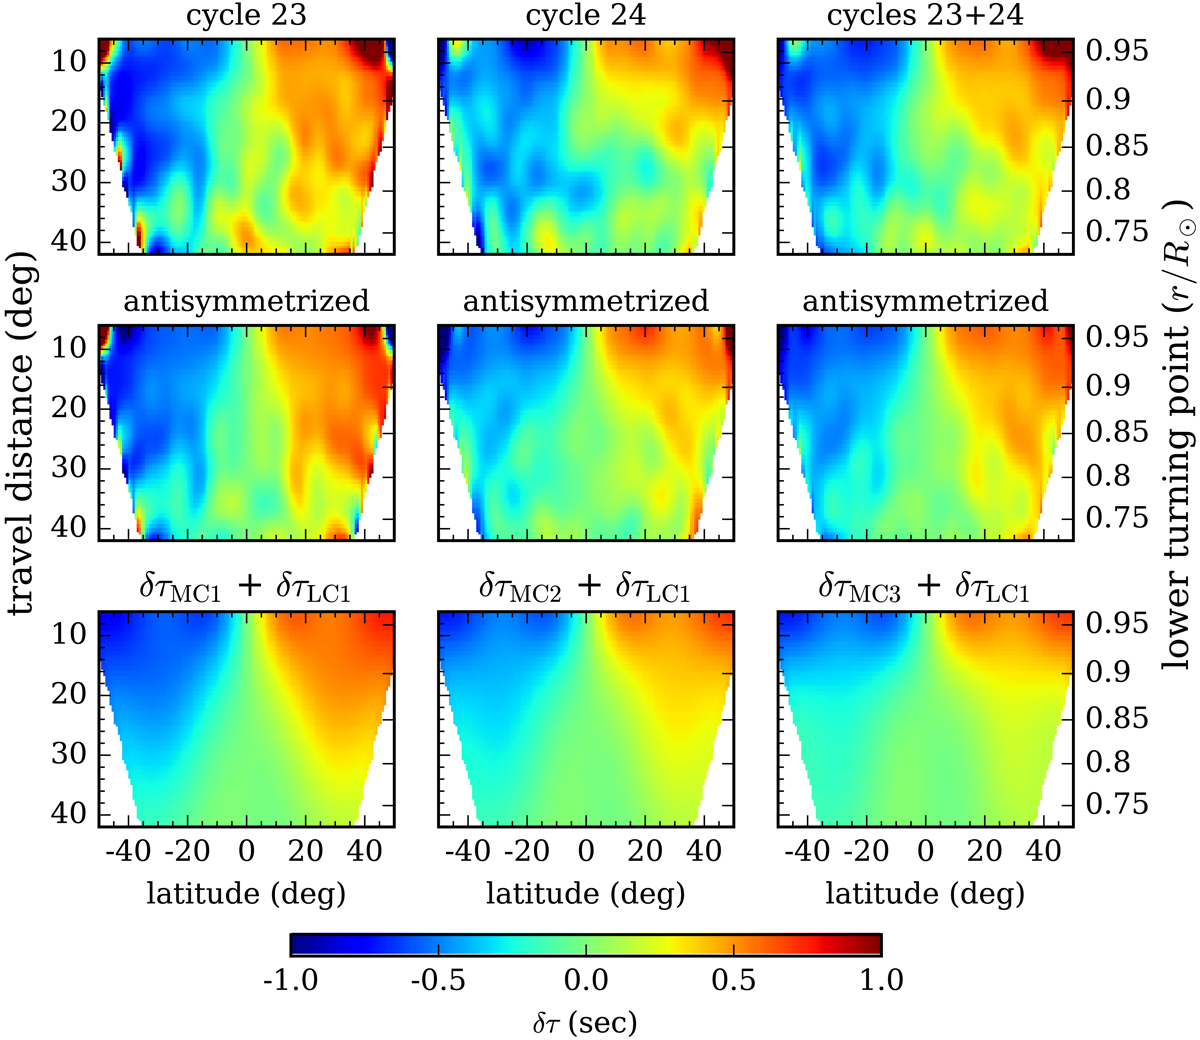
Fig. 11.

Measured and forward-modeled travel-time shifts as a function of distance and latitude. The top row shows maps of the three measured travel-time shifts, δτ′sn;23, δτ′sn;24, and δτ′sn;23+24, from left to right. The middle row shows the same δτ′sns as the top row but antisymmetrized about the equator. The bottom row shows the forward-modeled travel-time shifts derived from the MC1, MC2, and MC3 flow models, from left to right, in combination with that from model LC1. All maps of the measured and forward-modeled travel-time shifts are Gaussian smoothed with a FWHM of 7.2° in latitude and in distance. The data used to plot the top row are available at the CDS.
Current usage metrics show cumulative count of Article Views (full-text article views including HTML views, PDF and ePub downloads, according to the available data) and Abstracts Views on Vision4Press platform.
Data correspond to usage on the plateform after 2015. The current usage metrics is available 48-96 hours after online publication and is updated daily on week days.
Initial download of the metrics may take a while.


