Fig. 14.
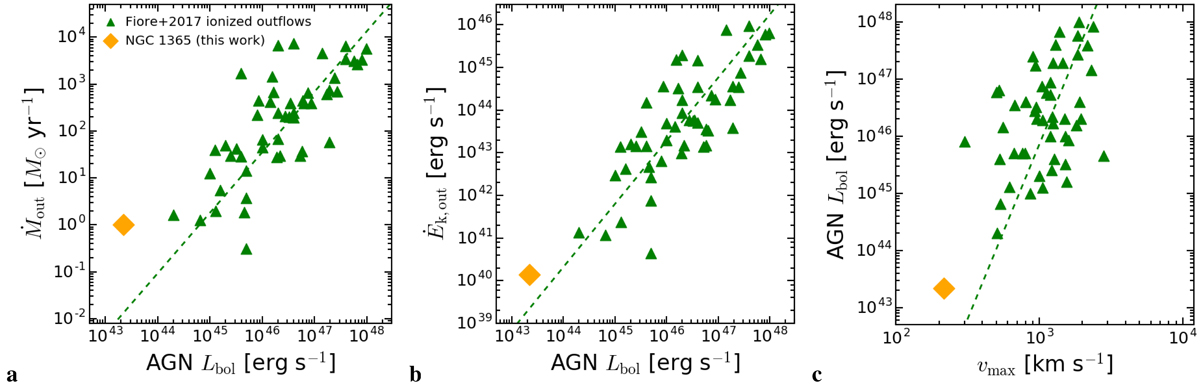
Panel a: mass outflow rate as a function of the AGN bolometric luminosity. The green symbols mark the ionized outflow measurements from Fiore et al. (2017), while the orange diamond is our estimate for the ionized outflow in NGC 1365, having calculated the mass outflow rate and the maximum outflow velocity consistently with Fiore et al. (2017) from the integrated spectra of the two outflowing cones (see text). The green dashed line is the best-fit correlation from Fiore et al. (2017) for their ionized outflow sample. Panel b: kinetic energy rate as a function of the AGN bolometric luminosity. Panel c: AGN bolometric luminosity as a function of the maximum outflow velocity.
Current usage metrics show cumulative count of Article Views (full-text article views including HTML views, PDF and ePub downloads, according to the available data) and Abstracts Views on Vision4Press platform.
Data correspond to usage on the plateform after 2015. The current usage metrics is available 48-96 hours after online publication and is updated daily on week days.
Initial download of the metrics may take a while.