Free Access
Fig. 6
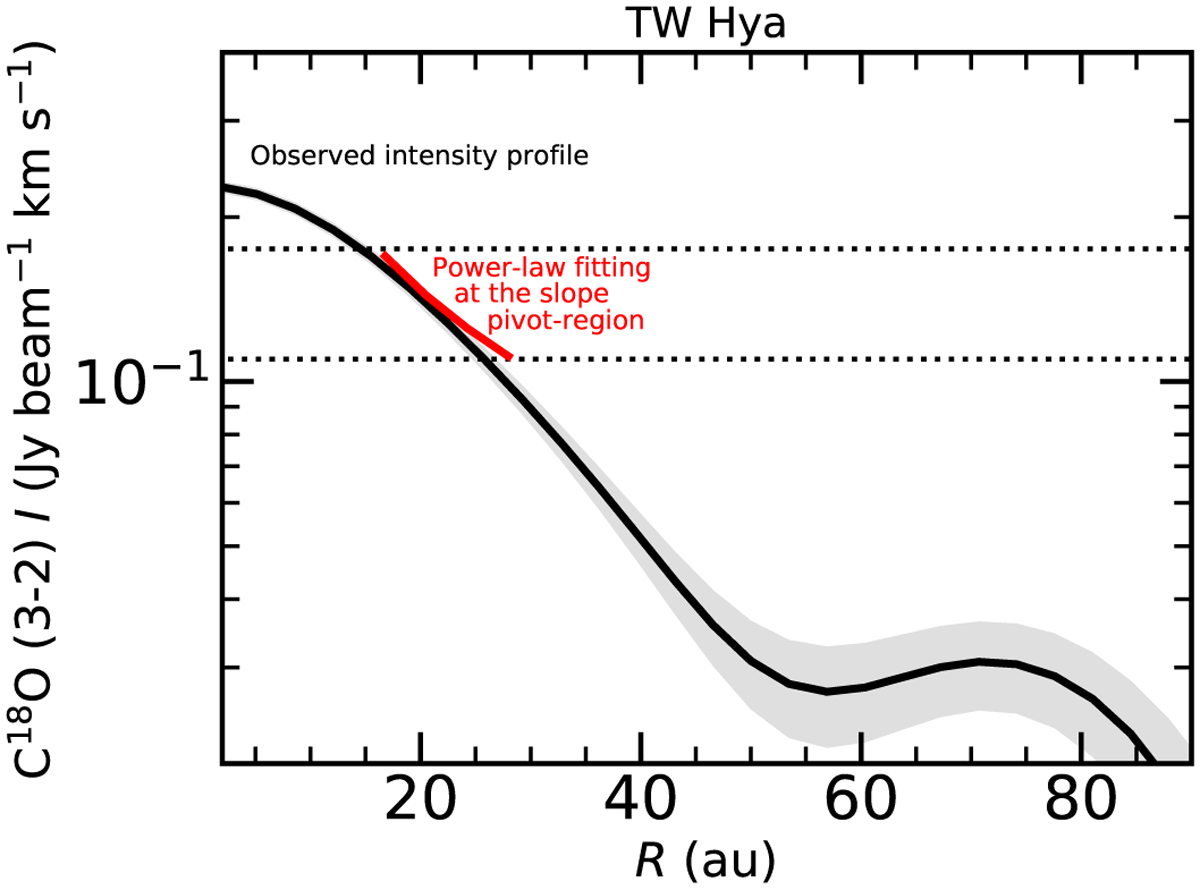
Radial intensity profile of the C18O (3–2) line observed with ALMA (Schwarz et al. 2016) is shown in black and the 3Σ level of uncertainty is presented by the shaded region. The red line shows the power-law function used to fit the data at the slope–pivot region.
Current usage metrics show cumulative count of Article Views (full-text article views including HTML views, PDF and ePub downloads, according to the available data) and Abstracts Views on Vision4Press platform.
Data correspond to usage on the plateform after 2015. The current usage metrics is available 48-96 hours after online publication and is updated daily on week days.
Initial download of the metrics may take a while.