Fig. 5
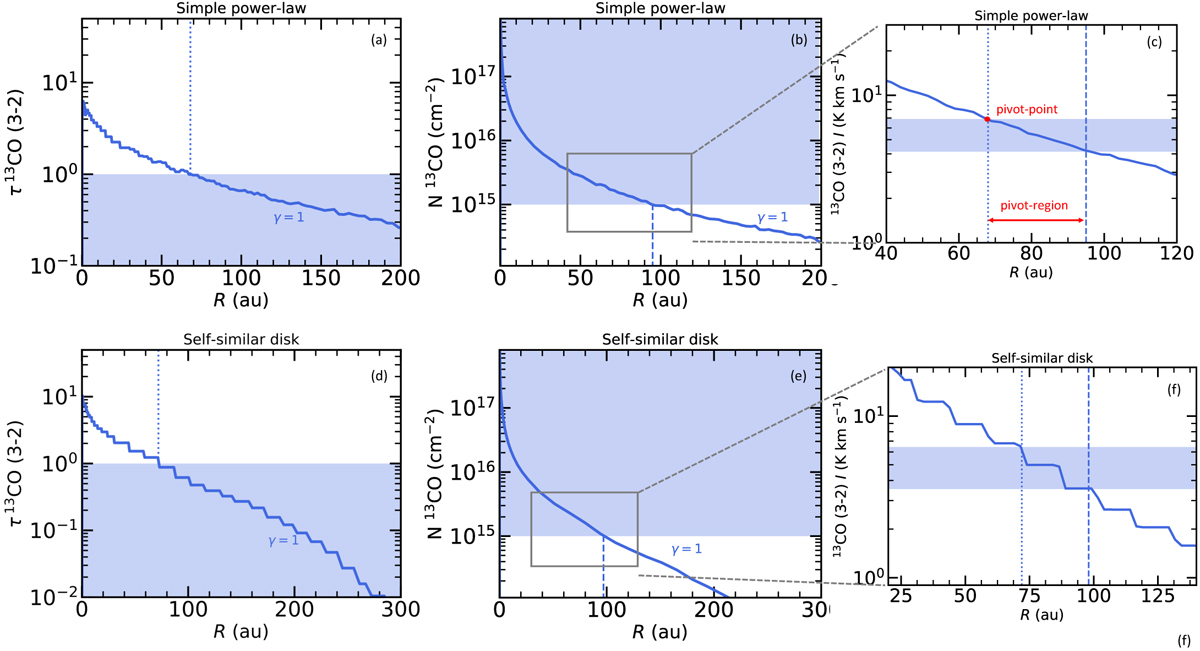
Total 13CO line optical depth τ (panels a and d), 13CO column density (panels b and e), and 13CO intensity radial profiles for simple power-law disk models (top panels) and self-similar disk models (bottom panels). The total disk mass is set to Mdisk = 10−4M⊙ and γ = 1. The shaded regions in panels a and d show the range where τ < 1, which holds for radii larger than those shown by the dotted lines. The shaded region in panels b and e shows the region where 13CO column densities are larger than 1015 cm−2, i.e., for radii smaller than those shown by the dashed lines. The shaded regions in panels c and f show the range of 13 CO line intensityfor which the conditions τ < 1 and N13CO > 1015 cm−2 hold. The fit of γ is performed over the “slope–pivot region” between the dotted and dashed lines, shown by the red arrow in panel c.
Current usage metrics show cumulative count of Article Views (full-text article views including HTML views, PDF and ePub downloads, according to the available data) and Abstracts Views on Vision4Press platform.
Data correspond to usage on the plateform after 2015. The current usage metrics is available 48-96 hours after online publication and is updated daily on week days.
Initial download of the metrics may take a while.