Fig. 4
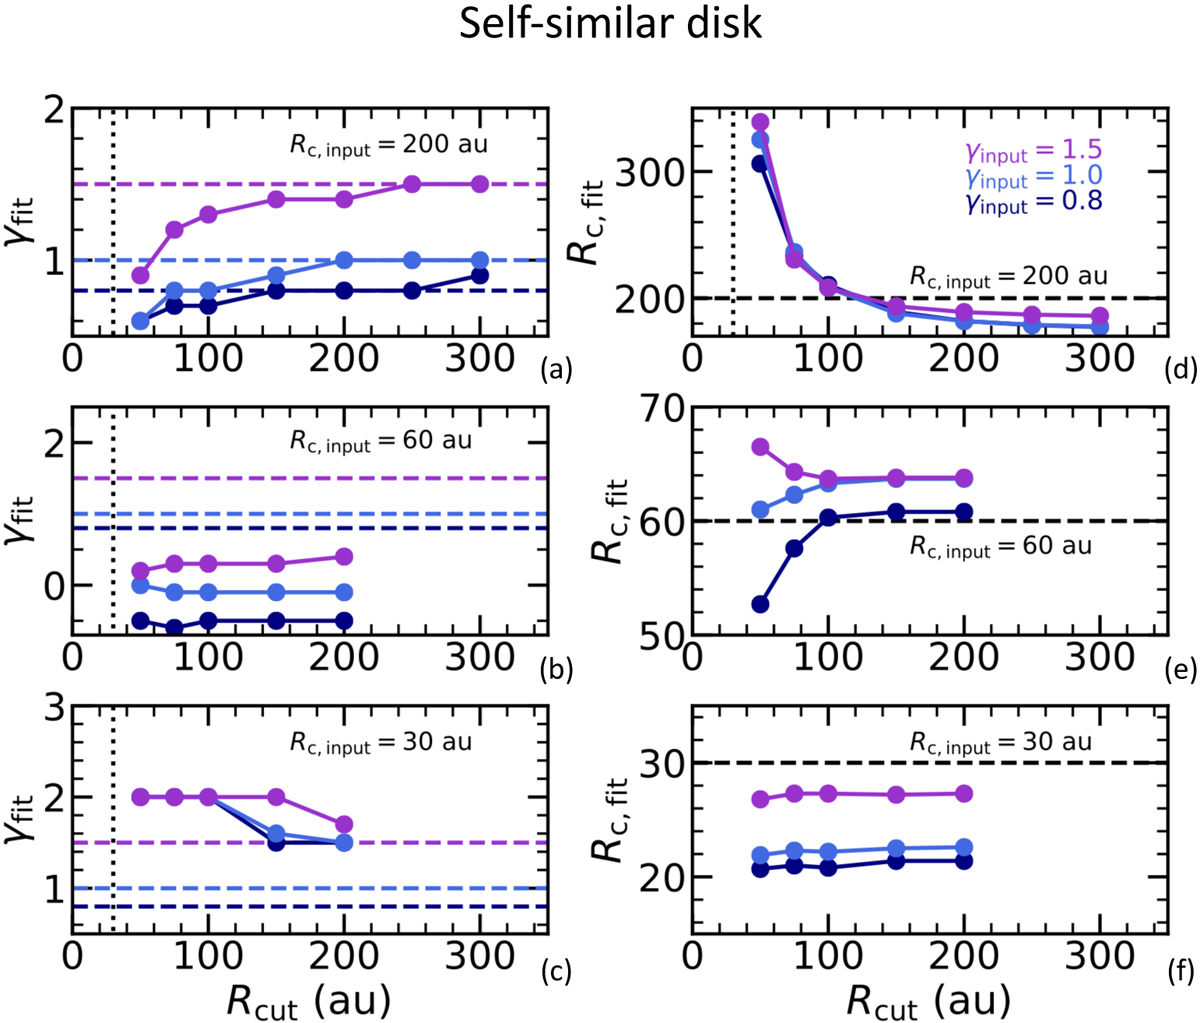
Results of the power-law fitting of the simulated 13CO line intensityprofiles obtained with the self-similar disk models with Mdisk = 10−4 M⊙. The values of the fitted power-law index γfit are shown by the filled dots as a function of the radial range in which the fitting was carried out. The model input power-law indexes are shown by the dashed lines. The dotted line shows the starting point of the fitting Rstart .
Current usage metrics show cumulative count of Article Views (full-text article views including HTML views, PDF and ePub downloads, according to the available data) and Abstracts Views on Vision4Press platform.
Data correspond to usage on the plateform after 2015. The current usage metrics is available 48-96 hours after online publication and is updated daily on week days.
Initial download of the metrics may take a while.