Fig. 8
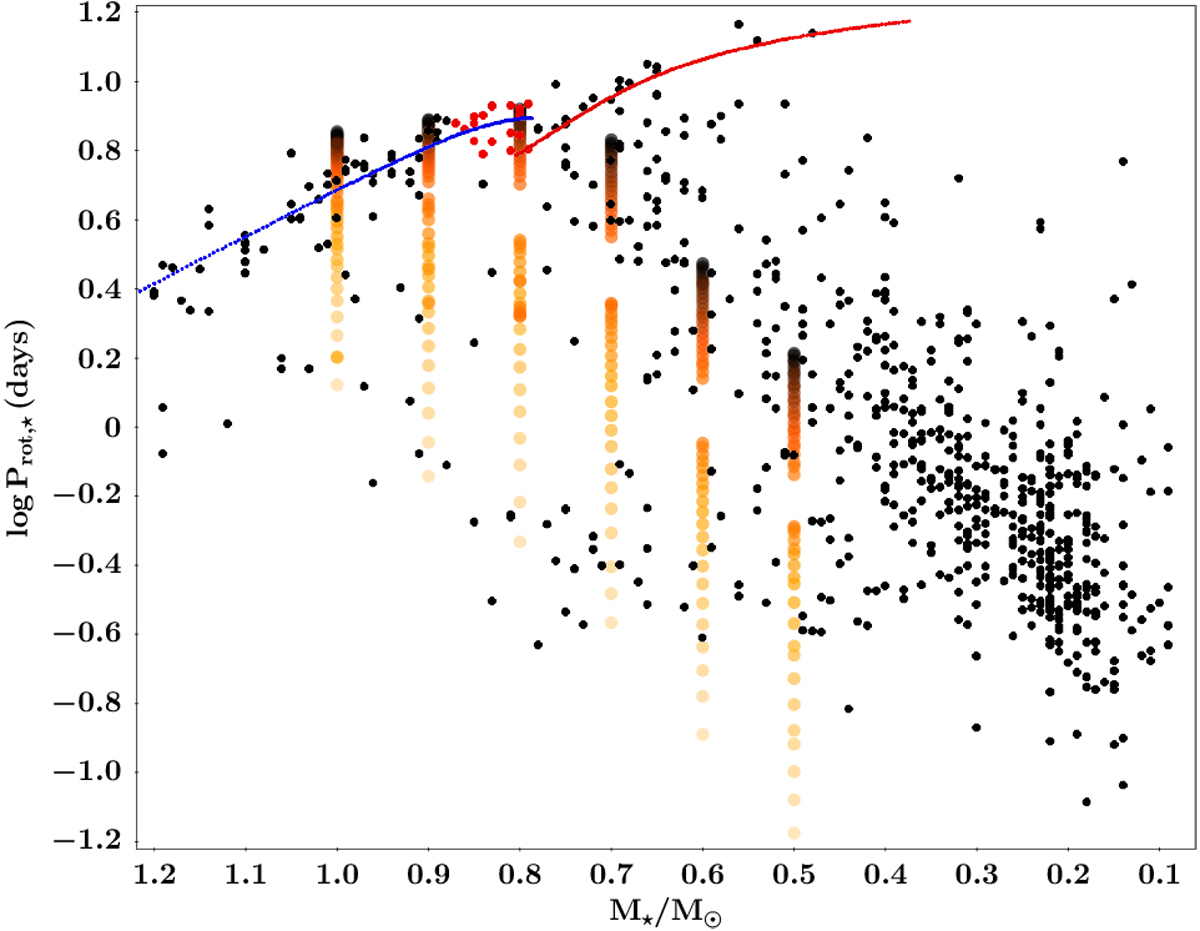
Rotation period distribution of stars between 0.1 and 1.2 M⊙ from the 120 Myr Pleiades cluster. The red circles correspond to the stars that display the rotational kink. Data are from Rebull et al. (2016) and Stauffer et al. (2016). The stellar masses are estimated using the absolute Ks magnitudes and the 125 Myr isochrones from Baraffe et al. (2015). The blue and red lines correspond to the least-squares fit to the slowest rotating stars inferred by Stauffer et al. (2016, see their Fig. 2). The rotational distributions are the same as in Fig. 7.
Current usage metrics show cumulative count of Article Views (full-text article views including HTML views, PDF and ePub downloads, according to the available data) and Abstracts Views on Vision4Press platform.
Data correspond to usage on the plateform after 2015. The current usage metrics is available 48-96 hours after online publication and is updated daily on week days.
Initial download of the metrics may take a while.