Fig. 6
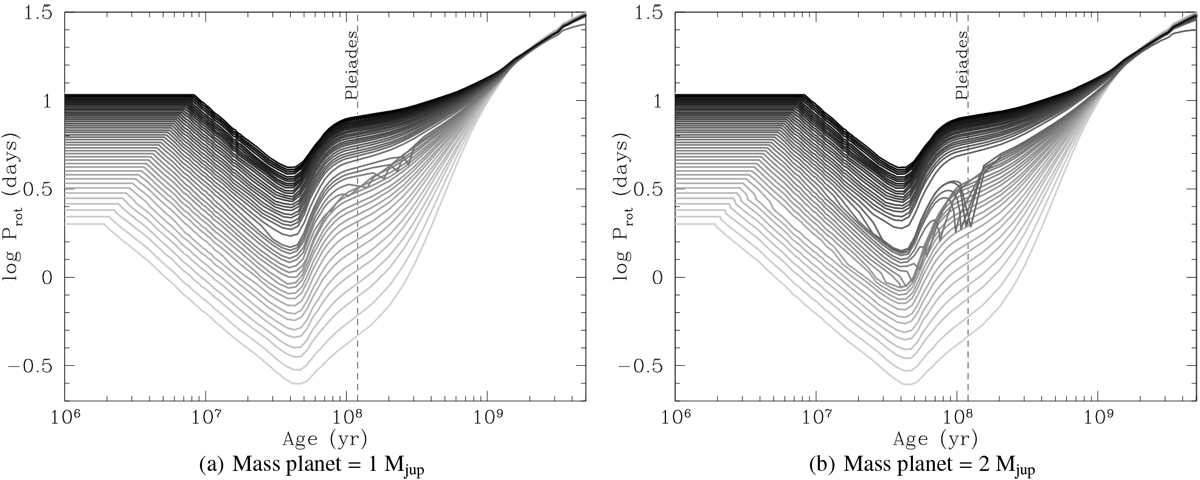
Temporal evolution of the rotation distribution related to the 0.8 M⊙ mass star. The mass of the planet is taken to be 1 Mjup (panel a) and 2 Mjup (panel b) and is initially located at 0.5 Rco. Each line correspond to one stellar configuration. The bottom grey line corresponds to an initial period of two days, the upper black line corresponds to an initial period of 11 days. The consecutive difference between each line is 0.2 day.
Current usage metrics show cumulative count of Article Views (full-text article views including HTML views, PDF and ePub downloads, according to the available data) and Abstracts Views on Vision4Press platform.
Data correspond to usage on the plateform after 2015. The current usage metrics is available 48-96 hours after online publication and is updated daily on week days.
Initial download of the metrics may take a while.