Fig. 4
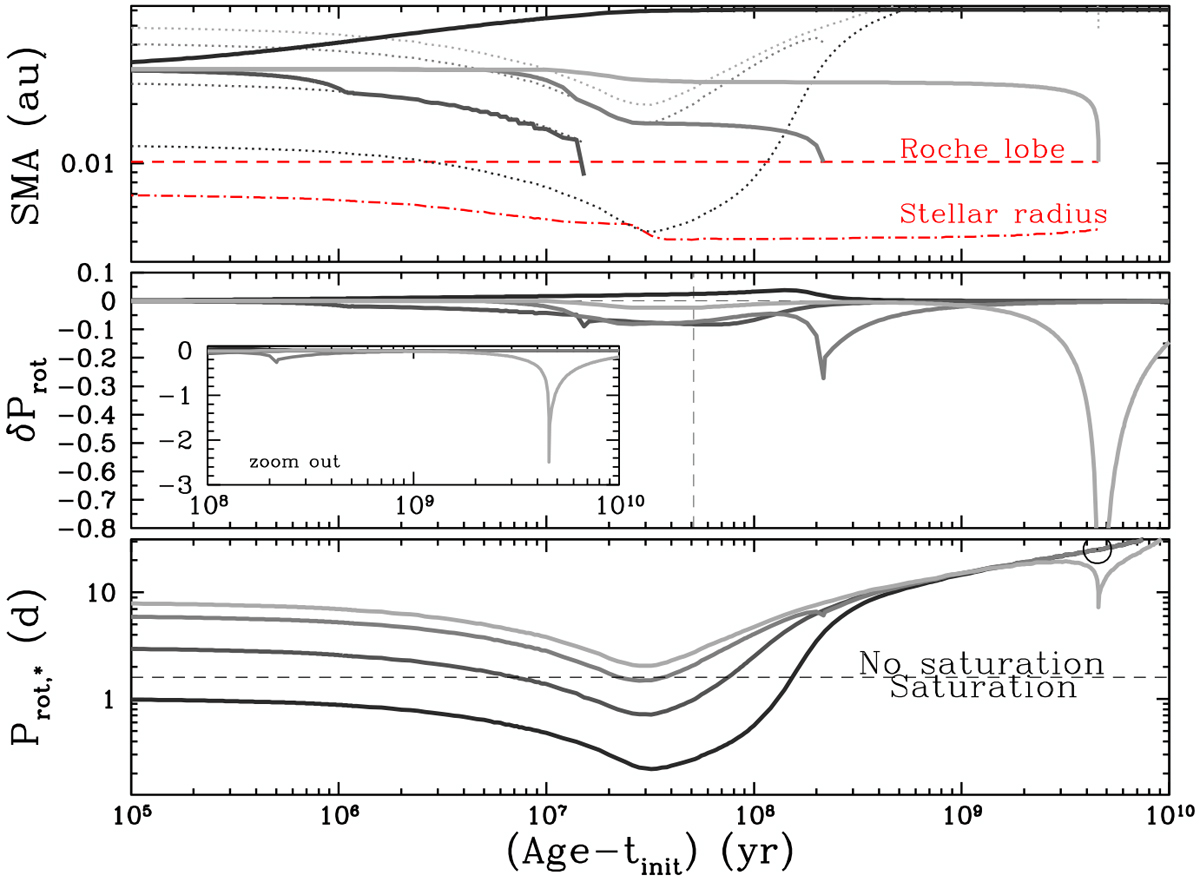
Evolution of the orbital distance of a Jupiter-mass planet with an initial SMA of 0.03 au (top panel), δProt (middle panel), and the stellar rotation period (bottom panel) during the evolution of a 1.0 M⊙ star with four different initial rotation rates: one, three, six, and eight days from darkish to greyish coloured lines, respectively. In the upper panel, the dotted lines correspond to the Porb = 1∕2 Prot,⋆ limit, the red dashed line is the Roche lobe limit, and the red dashed-dotted line is the stellar radius.
Current usage metrics show cumulative count of Article Views (full-text article views including HTML views, PDF and ePub downloads, according to the available data) and Abstracts Views on Vision4Press platform.
Data correspond to usage on the plateform after 2015. The current usage metrics is available 48-96 hours after online publication and is updated daily on week days.
Initial download of the metrics may take a while.