Fig. 2
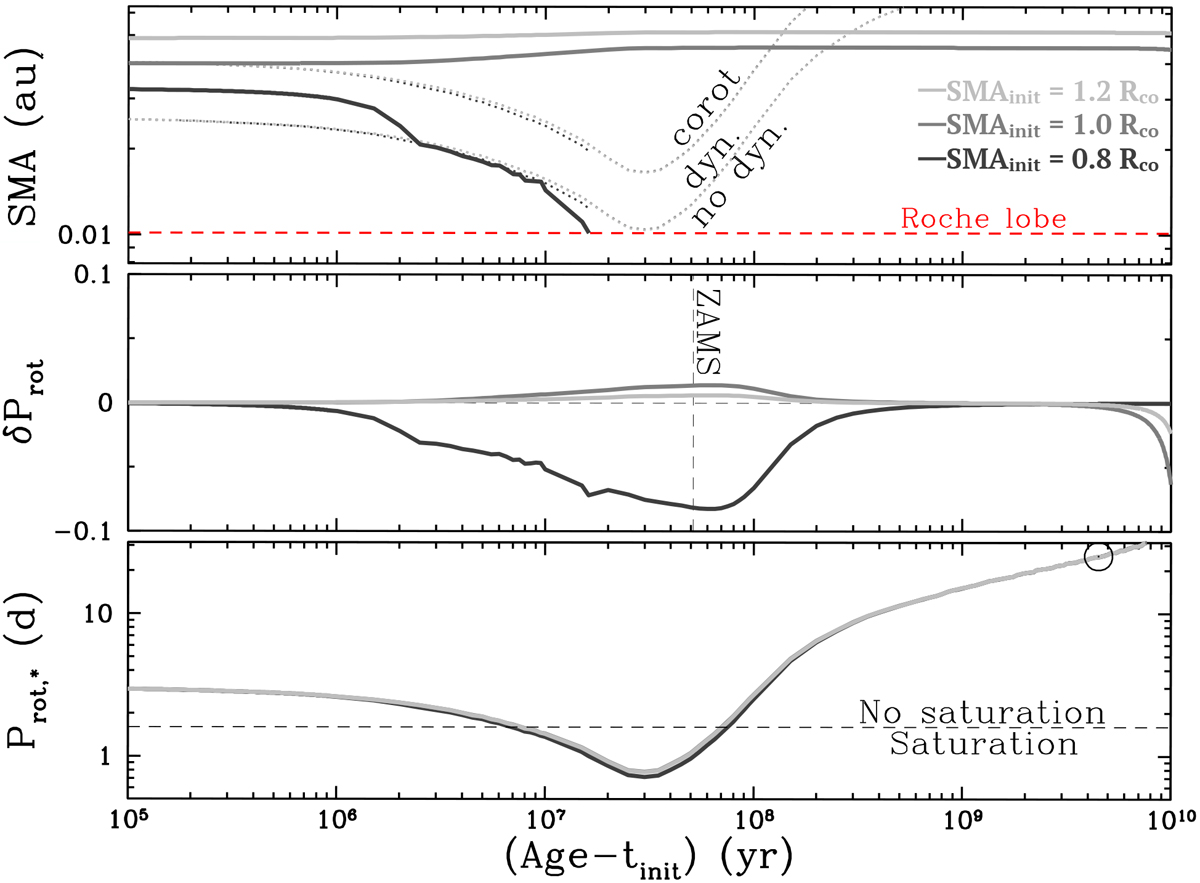
Evolution of the orbital distance of a Jupiter-mass planet with different initial SMA (top panel) ranging from 0.8 Rco (black), 1.0 Rco (dark grey), and 1.2 Rco (light grey), δProt (middle panel), and the stellar rotation period (bottom panel) during the evolution of a 1.0 M⊙ star with an initial rotation period of three days and a coupling timescale τc-e of 0.5 Myr. Upper panel: the orbital distance of the planet is represented in full coloured lines. The upper dotted lines correspond to Porb = Prot,⋆ (the corotation limit) and the lower dotted lines correspond to Porb = 1/2 Prot,⋆ limit, which marks the region above which the dynamical tide operates. The red long-dashed line is the evolution of the Roche lobe radius. Middle panel: departure of the rotation rate of the host star (Prot,⋆ ) from an isolated star (Prot,isol.). The horizontal dashed line indicates no difference with an isolated star, and the vertical dashed line represents the localisation of the ZAMS (around 50 Myr for a 1.0 M⊙ star). Lower panel: rotation period (in days) of the host star. The horizontal dashed line correspond to the transition between saturated and unsaturated magnetic regimes (1.6 days ≈ 16 Ω⊙), and the circle represents the rotation rate of the present Sun. The time on the x-axis is given from an initial time tinit of 5 Myr.
Current usage metrics show cumulative count of Article Views (full-text article views including HTML views, PDF and ePub downloads, according to the available data) and Abstracts Views on Vision4Press platform.
Data correspond to usage on the plateform after 2015. The current usage metrics is available 48-96 hours after online publication and is updated daily on week days.
Initial download of the metrics may take a while.