Fig. 8.

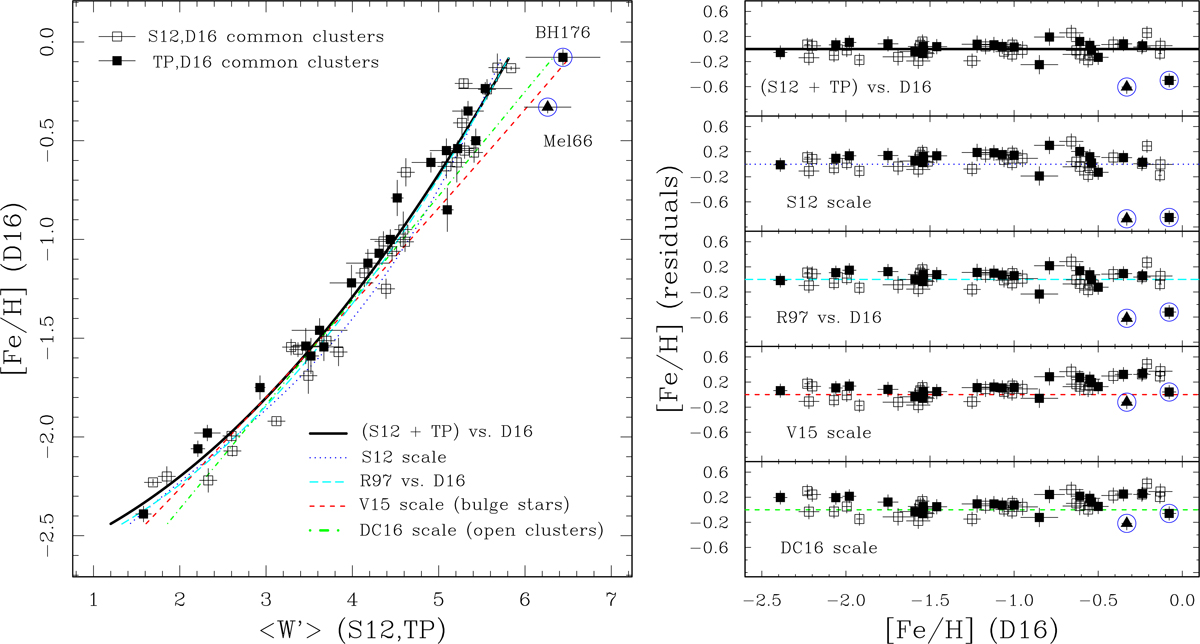
Comparison between the metallicities of GGCs derived from the optical spectral range (Dias et al. 2016a) and the mean reduced equivalent widths 〈W′〉 for the clusters in common with data in this paper (filled squares) and the S12 sample (open squares). The peculiar cluster BH 176 and the open cluster Mel 66 are marked by open circles. Different CaT calibrations are shown: the best fit to the merged FORS2 sample as a black solid line, the Saviane et al. (2012) relation as a blue dotted line, and the Rutledge et al. (1997) calibration (converted to our W′ scale) as a cyan dashed line. These relations based on globular cluster data share a common curved trend. In addition, the Vásquez et al. (2015) fit which includes bulge stars on the metal-rich side is shown as a red dashed line, and the calibration of Da Costa (2016) based on stars in globular and open clusters is represented by the green dot-dashed line. In the right panels we plot the [Fe/H] residuals (this work − D16) for five CaT calibrations. See discussion in the text.
Current usage metrics show cumulative count of Article Views (full-text article views including HTML views, PDF and ePub downloads, according to the available data) and Abstracts Views on Vision4Press platform.
Data correspond to usage on the plateform after 2015. The current usage metrics is available 48-96 hours after online publication and is updated daily on week days.
Initial download of the metrics may take a while.


